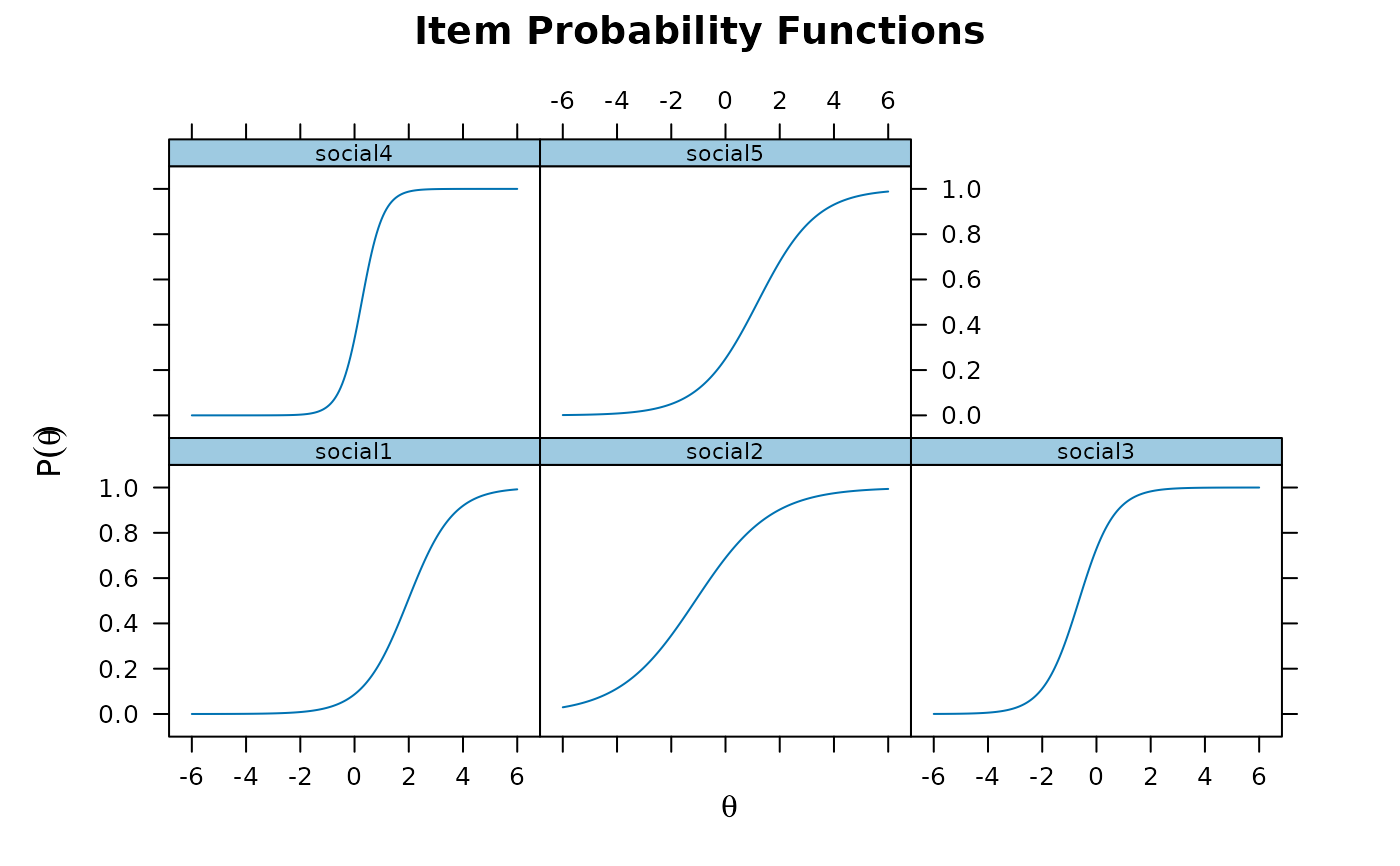
A 5-item data set analyzed by Bartholomew (1998). Data contains dichotomous responses (endorsement vs non-endorsement) from 1490 German respondents to five statements on perceptions of social life.
References
Bartholomew, D., J. (1998). Scaling unobservable constructs in social science. Journal of the Royal Statistical Society - Series C, 47, 1-13.
Author
Phil Chalmers rphilip.chalmers@gmail.com
Examples
# \donttest{
# tabular format
data(SLF)
SLF
#>    social1 social2 social3 social4 social5 freq
#> 1        0       0       0       0       0  156
#> 2        0       0       0       0       1   26
#> 3        0       0       0       1       0   14
#> 4        0       0       0       1       1    9
#> 5        0       0       1       0       0  127
#> 6        0       0       1       0       1   26
#> 7        0       0       1       1       0   66
#> 8        0       0       1       1       1   16
#> 9        0       1       0       0       0  174
#> 10       0       1       0       0       1   35
#> 11       0       1       0       1       0   36
#> 12       0       1       0       1       1   13
#> 13       0       1       1       0       0  208
#> 14       0       1       1       0       1   65
#> 15       0       1       1       1       0  195
#> 16       0       1       1       1       1  129
#> 17       1       0       0       0       0    8
#> 18       1       0       0       0       1    2
#> 19       1       0       0       1       0    1
#> 20       1       0       0       1       1    3
#> 21       1       0       1       0       0    4
#> 22       1       0       1       0       1    4
#> 23       1       0       1       1       0   18
#> 24       1       0       1       1       1    9
#> 25       1       1       0       0       0    8
#> 26       1       1       0       0       1    2
#> 27       1       1       0       1       0    5
#> 28       1       1       0       1       1    3
#> 29       1       1       1       0       0   19
#> 30       1       1       1       0       1   10
#> 31       1       1       1       1       0   31
#> 32       1       1       1       1       1   68

# full dataset
full <- expand.table(SLF)
itemstats(full)
#> $overall
#>     N mean_total.score sd_total.score ave.r  sd.r alpha SEM.alpha
#>  1490            2.166          1.324 0.187 0.076 0.536     0.902
#>
#> $itemstats
#>            N  mean    sd total.r total.r_if_rm alpha_if_rm
#> social1 1490 0.131 0.337   0.482         0.251       0.510
#> social2 1490 0.672 0.470   0.550         0.227       0.527
#> social3 1490 0.668 0.471   0.632         0.335       0.458
#> social4 1490 0.413 0.493   0.702         0.420       0.397
#> social5 1490 0.282 0.450   0.578         0.281       0.493
#>
#> $proportions
#>             0     1
#> social1 0.869 0.131
#> social2 0.328 0.672
#> social3 0.332 0.668
#> social4 0.587 0.413
#> social5 0.718 0.282
#>

mod <- mirt(full)
plot(mod, type = 'trace')


# }
# }