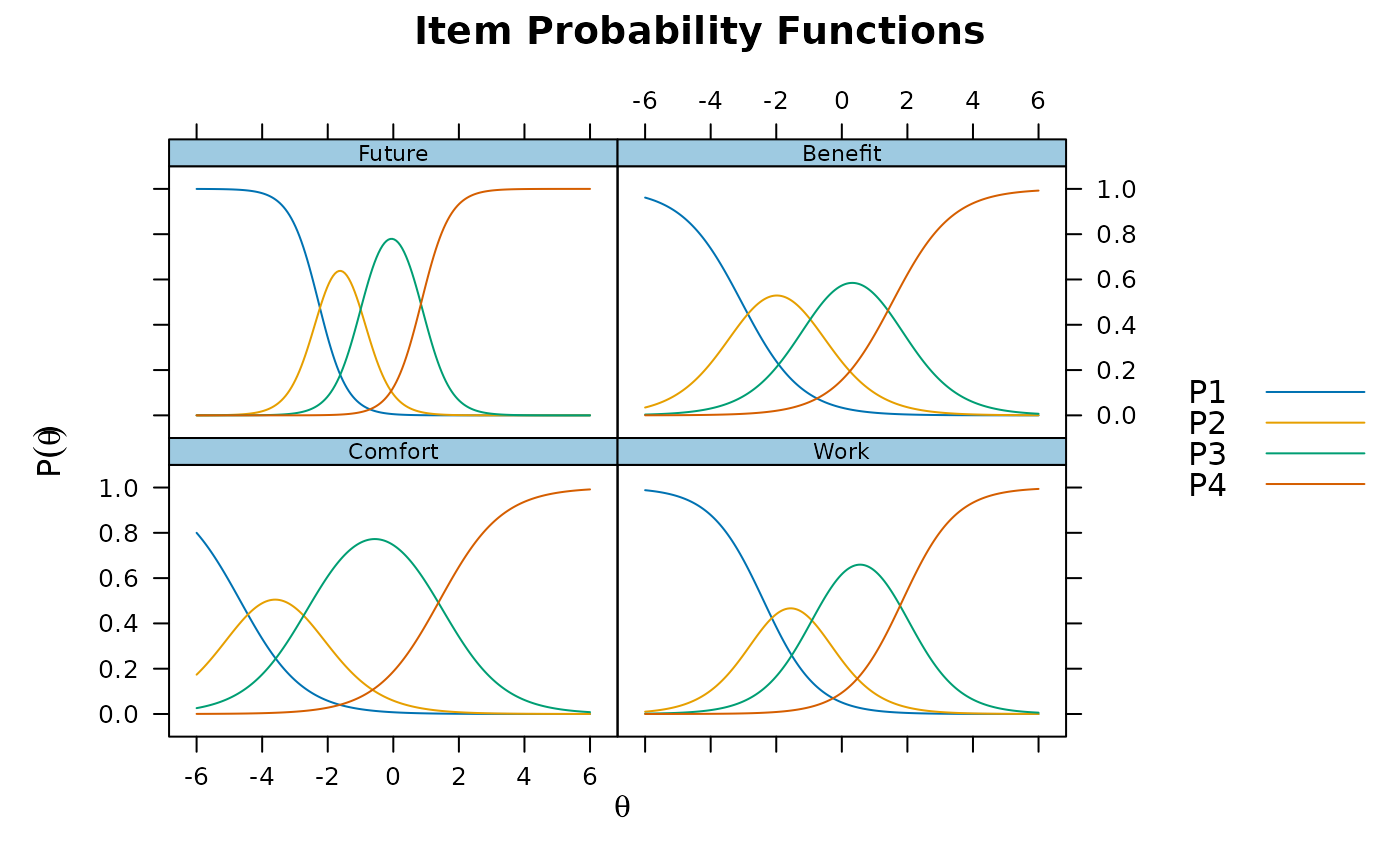
A 4-item data set borrowed from ltm package in R, first example
of the grm() function. See more complete documentation therein, as
well as Karlheinz and Melich (1992).
References
Karlheinz, R. and Melich, A. (1992). Euro-Barometer 38.1: Consumer Protection and Perceptions of Science and Technology. INRA (Europe), Brussels. [computer file]
Author
Phil Chalmers rphilip.chalmers@gmail.com
Examples
# \donttest{
itemstats(Science)
#> $overall
#>    N mean_total.score sd_total.score ave.r  sd.r alpha SEM.alpha
#>  392           11.668          2.003 0.275 0.098 0.598      1.27
#>
#> $itemstats
#>           N  mean    sd total.r total.r_if_rm alpha_if_rm
#> Comfort 392 3.120 0.588   0.596         0.352       0.552
#> Work    392 2.722 0.807   0.666         0.332       0.567
#> Future  392 2.990 0.757   0.748         0.488       0.437
#> Benefit 392 2.837 0.802   0.684         0.363       0.541
#>
#> $proportions
#>             1     2     3     4
#> Comfort 0.013 0.082 0.679 0.227
#> Work    0.084 0.250 0.526 0.140
#> Future  0.036 0.184 0.536 0.245
#> Benefit 0.054 0.255 0.492 0.199
#>

mod <- mirt(Science, 1)
plot(mod, type = 'trace')

# }
# }