Table of counts extracted from Andrich (1988). Data the response patterns observed for an eight item survey.
Details
The items in this survey were:
Capital punishment is one of the most hideous practices of our time.
The state cannot teach the sacredness of human life by destroying it.
Capital punishment is not an effective deterrent to crime.
I don't believe in capital punishment but I am not sure it isn't necessary.
I think capital punishment is necessary but I wish it were not.
Until we find a more civilized way to prevent crime we must have capital punishment.
Capital punishment is justified because it does act as a deterrent to crime.
Capital punishment gives the criminal what he deserves.
References
Andrich, D. (1988). The Application of an Unfolding Model of the PIRT Type to the Measurement of Attitude. Applied Psychological Measurement, 12, 33-51.
Author
Phil Chalmers rphilip.chalmers@gmail.com
Examples
head(Attitude)
#> hideous state_teaching deterrent believe_not.necessary necessary_wish.not
#> 1 0 1 1 0 0
#> 2 1 1 1 0 0
#> 3 0 1 1 1 0
#> 4 1 1 1 1 0
#> 5 0 1 1 1 1
#> 6 0 1 1 1 0
#> must.have justified deserved freq
#> 1 0 0 0 4
#> 2 0 0 0 10
#> 3 0 0 0 3
#> 4 0 0 0 8
#> 5 0 0 0 1
#> 6 0 1 0 1
df <- expand.table(Attitude)
itemstats(df)
#> $overall
#> N mean_total.score sd_total.score ave.r sd.r alpha SEM.alpha
#> 54 3.852 1.053 -0.064 0.524 -0.849 1.433
#>
#> $itemstats
#> N K mean sd total.r total.r_if_rm alpha_if_rm
#> hideous 54 2 0.444 0.502 0.056 -0.388 -0.340
#> state_teaching 54 2 0.648 0.482 -0.290 -0.616 -0.046
#> deterrent 54 2 0.667 0.476 -0.251 -0.587 -0.088
#> believe_not.necessary 54 2 0.463 0.503 0.523 0.053 -1.260
#> necessary_wish.not 54 2 0.481 0.504 0.669 0.249 -1.836
#> must.have 54 2 0.444 0.502 0.591 0.141 -1.499
#> justified 54 2 0.352 0.482 0.402 -0.061 -0.959
#> deserved 54 2 0.352 0.482 0.402 -0.061 -0.959
#>
#> $proportions
#> 0 1
#> hideous 0.556 0.444
#> state_teaching 0.352 0.648
#> deterrent 0.333 0.667
#> believe_not.necessary 0.537 0.463
#> necessary_wish.not 0.519 0.481
#> must.have 0.556 0.444
#> justified 0.648 0.352
#> deserved 0.648 0.352
#>
# \donttest{
# estimate SSLM with estimated " latitude of acceptance" (rho)
mod.rho <- mirt(df, 1, itemtype = 'sslm')
coef(mod.rho)
#> $hideous
#> a1 d log_rho1
#> par 1 -0.929 0.089
#>
#> $state_teaching
#> a1 d log_rho1
#> par 1 -3.072 1.274
#>
#> $deterrent
#> a1 d log_rho1
#> par 1 -2.529 1.124
#>
#> $believe_not.necessary
#> a1 d log_rho1
#> par 1 -0.012 -0.236
#>
#> $necessary_wish.not
#> a1 d log_rho1
#> par 1 2.101 0.703
#>
#> $must.have
#> a1 d log_rho1
#> par 1 2.719 0.915
#>
#> $justified
#> a1 d log_rho1
#> par 1 2.278 0.605
#>
#> $deserved
#> a1 d log_rho1
#> par 1 8.142 2.032
#>
#> $GroupPars
#> MEAN_1 COV_11
#> par 0 1
#>
coef(mod.rho, simplify=TRUE) # slope-intercept-log_rho
#> $items
#> a1 d log_rho1
#> hideous 1 -0.929 0.089
#> state_teaching 1 -3.072 1.274
#> deterrent 1 -2.529 1.124
#> believe_not.necessary 1 -0.012 -0.236
#> necessary_wish.not 1 2.101 0.703
#> must.have 1 2.719 0.915
#> justified 1 2.278 0.605
#> deserved 1 8.142 2.032
#>
#> $means
#> F1
#> 0
#>
#> $cov
#> F1
#> F1 1
#>
coef(mod.rho, simplify=TRUE, IRTpars=TRUE) # discrimination-difficulty-rho
#> $items
#> a b rho1
#> hideous 1 0.929 1.093
#> state_teaching 1 3.072 3.575
#> deterrent 1 2.529 3.076
#> believe_not.necessary 1 0.012 0.790
#> necessary_wish.not 1 -2.101 2.020
#> must.have 1 -2.719 2.497
#> justified 1 -2.278 1.830
#> deserved 1 -8.142 7.629
#>
#> $means
#> F1
#> 0
#>
#> $cov
#> F1
#> F1 1
#>
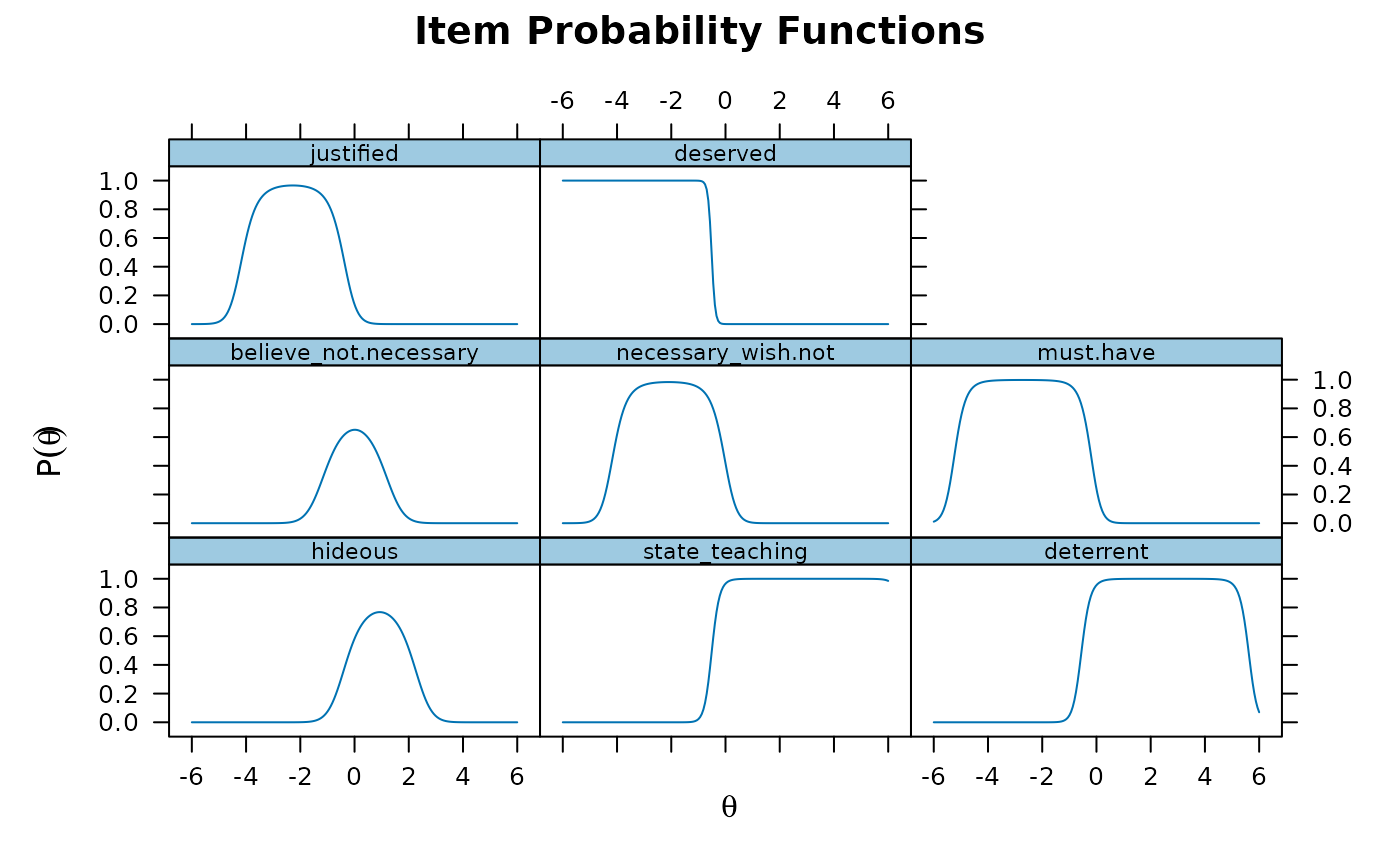
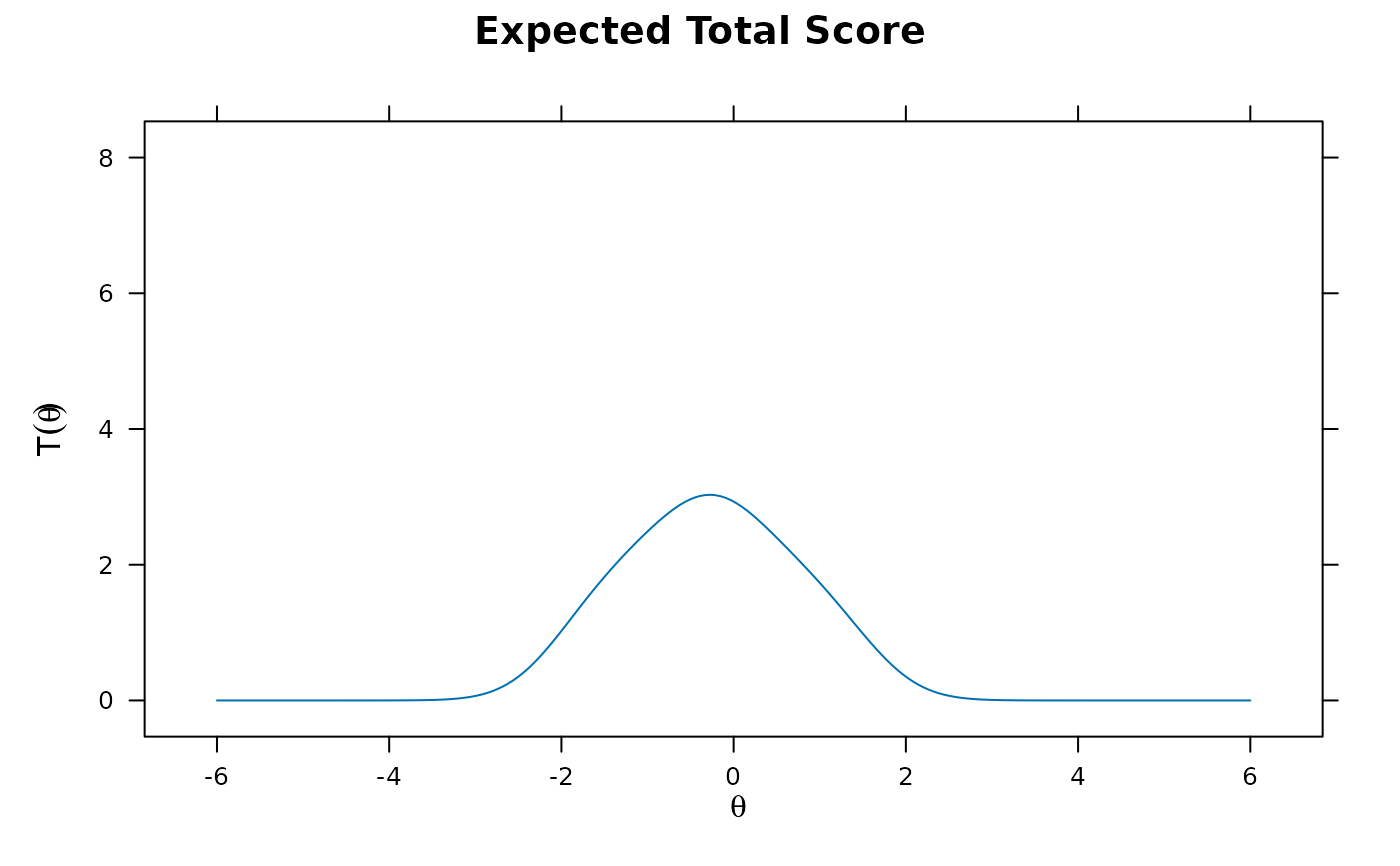
plot(mod.rho)
 plot(mod.rho, type = 'trace')
 # without estimating rho, and fixing to rho^2 = 1 (hence,
# log_rho = -exp(1) = -2.718282 in order to obtain (exp(exp(log_rho))) = 1)
syntax <- "Theta = 1-8
FIXED = (1-8, log_rho1)
START = (1-8, log_rho1, -2.71828)"
mod <- mirt(df, syntax, itemtype = 'sslm') # model found in Andrich (1988)
coef(mod)
#> $hideous
#> a1 d log_rho1
#> par 1 -0.622 -2.718
#>
#> $state_teaching
#> a1 d log_rho1
#> par 1 -0.517 -2.718
#>
#> $deterrent
#> a1 d log_rho1
#> par 1 -0.504 -2.718
#>
#> $believe_not.necessary
#> a1 d log_rho1
#> par 1 -0.05 -2.718
#>
#> $necessary_wish.not
#> a1 d log_rho1
#> par 1 0.783 -2.718
#>
#> $must.have
#> a1 d log_rho1
#> par 1 0.893 -2.718
#>
#> $justified
#> a1 d log_rho1
#> par 1 1.031 -2.718
#>
#> $deserved
#> a1 d log_rho1
#> par 1 1.099 -2.718
#>
#> $GroupPars
#> MEAN_1 COV_11
#> par 0 1
#>
coef(mod, simplify=TRUE) # slope-intercept-log_rho
#> $items
#> a1 d log_rho1
#> hideous 1 -0.622 -2.718
#> state_teaching 1 -0.517 -2.718
#> deterrent 1 -0.504 -2.718
#> believe_not.necessary 1 -0.050 -2.718
#> necessary_wish.not 1 0.783 -2.718
#> must.have 1 0.893 -2.718
#> justified 1 1.031 -2.718
#> deserved 1 1.099 -2.718
#>
#> $means
#> Theta
#> 0
#>
#> $cov
#> Theta
#> Theta 1
#>
coef(mod, simplify=TRUE, IRTpars=TRUE) # discrimination-difficulty-rho
#> $items
#> a b rho1
#> hideous 1 0.622 0.066
#> state_teaching 1 0.517 0.066
#> deterrent 1 0.504 0.066
#> believe_not.necessary 1 0.050 0.066
#> necessary_wish.not 1 -0.783 0.066
#> must.have 1 -0.893 0.066
#> justified 1 -1.031 0.066
#> deserved 1 -1.099 0.066
#>
#> $means
#> Theta
#> 0
#>
#> $cov
#> Theta
#> Theta 1
#>
plot(mod)
# without estimating rho, and fixing to rho^2 = 1 (hence,
# log_rho = -exp(1) = -2.718282 in order to obtain (exp(exp(log_rho))) = 1)
syntax <- "Theta = 1-8
FIXED = (1-8, log_rho1)
START = (1-8, log_rho1, -2.71828)"
mod <- mirt(df, syntax, itemtype = 'sslm') # model found in Andrich (1988)
coef(mod)
#> $hideous
#> a1 d log_rho1
#> par 1 -0.622 -2.718
#>
#> $state_teaching
#> a1 d log_rho1
#> par 1 -0.517 -2.718
#>
#> $deterrent
#> a1 d log_rho1
#> par 1 -0.504 -2.718
#>
#> $believe_not.necessary
#> a1 d log_rho1
#> par 1 -0.05 -2.718
#>
#> $necessary_wish.not
#> a1 d log_rho1
#> par 1 0.783 -2.718
#>
#> $must.have
#> a1 d log_rho1
#> par 1 0.893 -2.718
#>
#> $justified
#> a1 d log_rho1
#> par 1 1.031 -2.718
#>
#> $deserved
#> a1 d log_rho1
#> par 1 1.099 -2.718
#>
#> $GroupPars
#> MEAN_1 COV_11
#> par 0 1
#>
coef(mod, simplify=TRUE) # slope-intercept-log_rho
#> $items
#> a1 d log_rho1
#> hideous 1 -0.622 -2.718
#> state_teaching 1 -0.517 -2.718
#> deterrent 1 -0.504 -2.718
#> believe_not.necessary 1 -0.050 -2.718
#> necessary_wish.not 1 0.783 -2.718
#> must.have 1 0.893 -2.718
#> justified 1 1.031 -2.718
#> deserved 1 1.099 -2.718
#>
#> $means
#> Theta
#> 0
#>
#> $cov
#> Theta
#> Theta 1
#>
coef(mod, simplify=TRUE, IRTpars=TRUE) # discrimination-difficulty-rho
#> $items
#> a b rho1
#> hideous 1 0.622 0.066
#> state_teaching 1 0.517 0.066
#> deterrent 1 0.504 0.066
#> believe_not.necessary 1 0.050 0.066
#> necessary_wish.not 1 -0.783 0.066
#> must.have 1 -0.893 0.066
#> justified 1 -1.031 0.066
#> deserved 1 -1.099 0.066
#>
#> $means
#> Theta
#> 0
#>
#> $cov
#> Theta
#> Theta 1
#>
plot(mod)
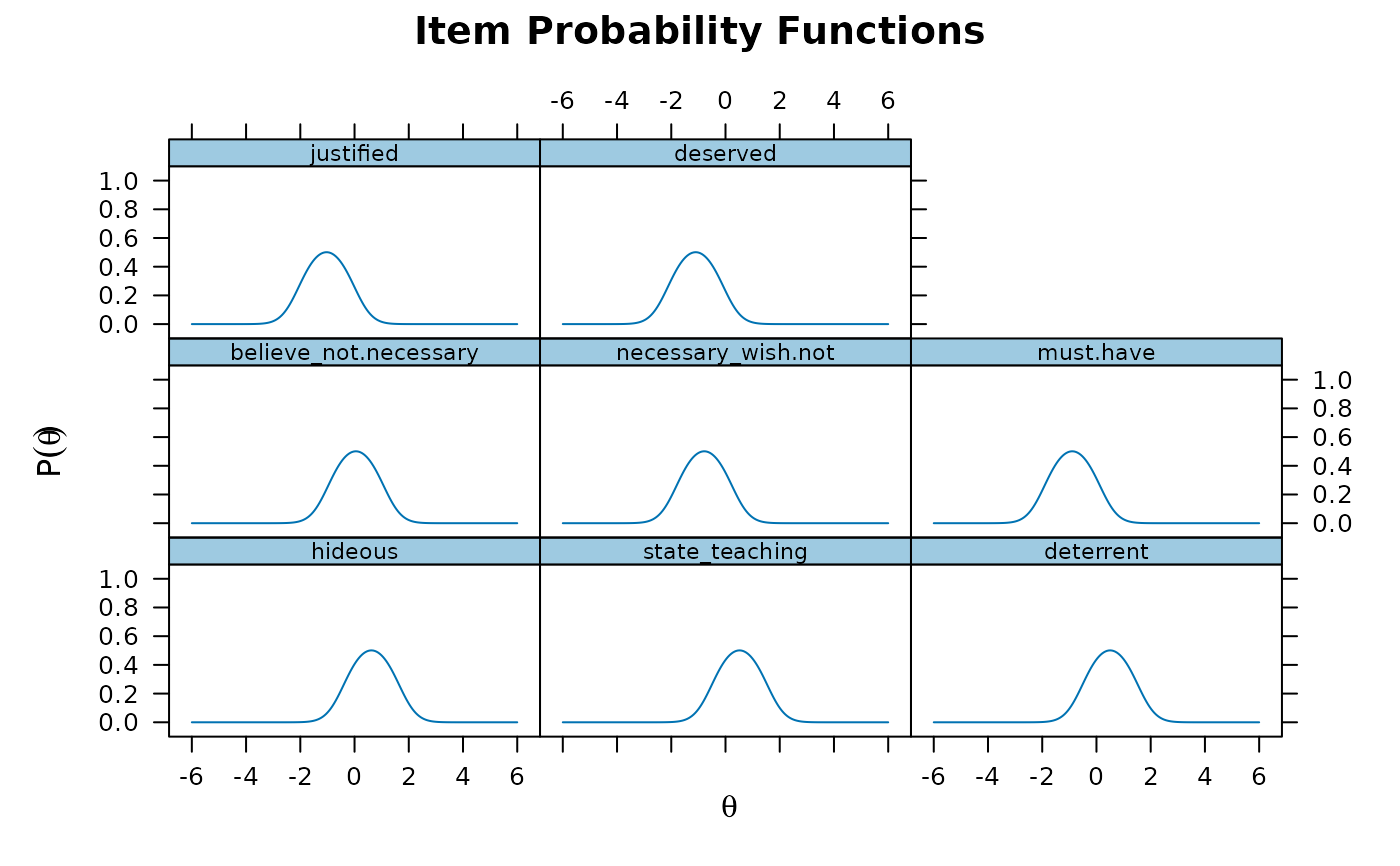
 plot(mod, type = 'trace') # notice that all curves have a fixed height of .5
 # goodness of fit (less constrained model fits better)
anova(mod, mod.rho) # original model fits much worse
#> AIC SABIC HQ BIC logLik X2 df p
#> mod 581.139 571.917 587.275 597.051 -282.569
#> mod.rho 422.326 403.882 434.599 454.149 -195.163 174.813 8 0
M2(mod)
#> M2 df p RMSEA RMSEA_5 RMSEA_95 SRMSR TLI CFI
#> stats 271.098 28 0 0.405 0.358 0.445 0.423 0.359 0.359
M2(mod.rho)
#> M2 df p RMSEA RMSEA_5 RMSEA_95 SRMSR TLI CFI
#> stats 34.709 20 0.022 0.118 0.045 0.18 0.08 0.946 0.961
itemfit(mod, p.adjust='fdr')
#> item S_X2 df.S_X2 RMSEA.S_X2 p.S_X2
#> 1 hideous 9.192 4 0.156 0.075
#> 2 state_teaching 37.649 4 0.398 0.000
#> 3 deterrent 23.743 4 0.305 0.000
#> 4 believe_not.necessary 6.454 3 0.147 0.105
#> 5 necessary_wish.not 14.371 3 0.267 0.007
#> 6 must.have 8.953 3 0.193 0.048
#> 7 justified 4.967 4 0.068 0.291
#> 8 deserved 11.061 3 0.225 0.023
itemfit(mod.rho, p.adjust='fdr')
#> item S_X2 df.S_X2 RMSEA.S_X2 p.S_X2
#> 1 hideous 0.893 2 0.000 0.640
#> 2 state_teaching 12.861 2 0.320 0.013
#> 3 deterrent 1.824 1 0.125 0.301
#> 4 believe_not.necessary 0.310 1 0.000 0.640
#> 5 necessary_wish.not 2.816 1 0.185 0.249
#> 6 must.have 1.465 1 0.094 0.301
#> 7 justified 1.494 1 0.097 0.301
#> 8 deserved 6.713 2 0.211 0.139
# }
# goodness of fit (less constrained model fits better)
anova(mod, mod.rho) # original model fits much worse
#> AIC SABIC HQ BIC logLik X2 df p
#> mod 581.139 571.917 587.275 597.051 -282.569
#> mod.rho 422.326 403.882 434.599 454.149 -195.163 174.813 8 0
M2(mod)
#> M2 df p RMSEA RMSEA_5 RMSEA_95 SRMSR TLI CFI
#> stats 271.098 28 0 0.405 0.358 0.445 0.423 0.359 0.359
M2(mod.rho)
#> M2 df p RMSEA RMSEA_5 RMSEA_95 SRMSR TLI CFI
#> stats 34.709 20 0.022 0.118 0.045 0.18 0.08 0.946 0.961
itemfit(mod, p.adjust='fdr')
#> item S_X2 df.S_X2 RMSEA.S_X2 p.S_X2
#> 1 hideous 9.192 4 0.156 0.075
#> 2 state_teaching 37.649 4 0.398 0.000
#> 3 deterrent 23.743 4 0.305 0.000
#> 4 believe_not.necessary 6.454 3 0.147 0.105
#> 5 necessary_wish.not 14.371 3 0.267 0.007
#> 6 must.have 8.953 3 0.193 0.048
#> 7 justified 4.967 4 0.068 0.291
#> 8 deserved 11.061 3 0.225 0.023
itemfit(mod.rho, p.adjust='fdr')
#> item S_X2 df.S_X2 RMSEA.S_X2 p.S_X2
#> 1 hideous 0.893 2 0.000 0.640
#> 2 state_teaching 12.861 2 0.320 0.013
#> 3 deterrent 1.824 1 0.125 0.301
#> 4 believe_not.necessary 0.310 1 0.000 0.640
#> 5 necessary_wish.not 2.816 1 0.185 0.249
#> 6 must.have 1.465 1 0.094 0.301
#> 7 justified 1.494 1 0.097 0.301
#> 8 deserved 6.713 2 0.211 0.139
# }