Function to calculate the area under a selection of information curves
Source:R/areainfo.R
areainfo.RdCompute the area of a test or item information function over a definite integral range.
Usage
areainfo(
  x,
  theta_lim,
  which.items = 1:extract.mirt(x, "nitems"),
  group = NULL,
  ...
)
Arguments
- x
an object of class 'SingleGroupClass', or an object of class 'MultipleGroupClass' if a suitable
groupinput were supplied- theta_lim
range of integration to be computed
- which.items
an integer vector indicating which items to include in the expected information function. Default uses all possible items
- group
group argument to pass to
extract.groupfunction. Required when the input object is a multiple-group model- ...
additional arguments passed to
integrate
Value
a data.frame with the lower and upper integration range, the information area
within the range (Info), the information area over the range -10 to 10 (Total.Info), proportion
of total information given the integration range (Info.Proportion), and the number of items included (nitems)
References
Chalmers, R., P. (2012). mirt: A Multidimensional Item Response Theory Package for the R Environment. Journal of Statistical Software, 48(6), 1-29. doi:10.18637/jss.v048.i06
Author
Phil Chalmers rphilip.chalmers@gmail.com
Examples
dat <- expand.table(LSAT7)
mod <- mirt(dat, 1)

areainfo(mod, c(-2,0), which.items = 1) #item 1
#>  LowerBound UpperBound      Info TotalInfo Proportion nitems
#>          -2          0 0.3899825 0.9879254  0.3947489      1
# \donttest{
areainfo(mod, c(-2,0), which.items = 1:3) #items 1 to 3
#>  LowerBound UpperBound     Info TotalInfo Proportion nitems
#>          -2          0 2.095673  3.774611  0.5552023      3
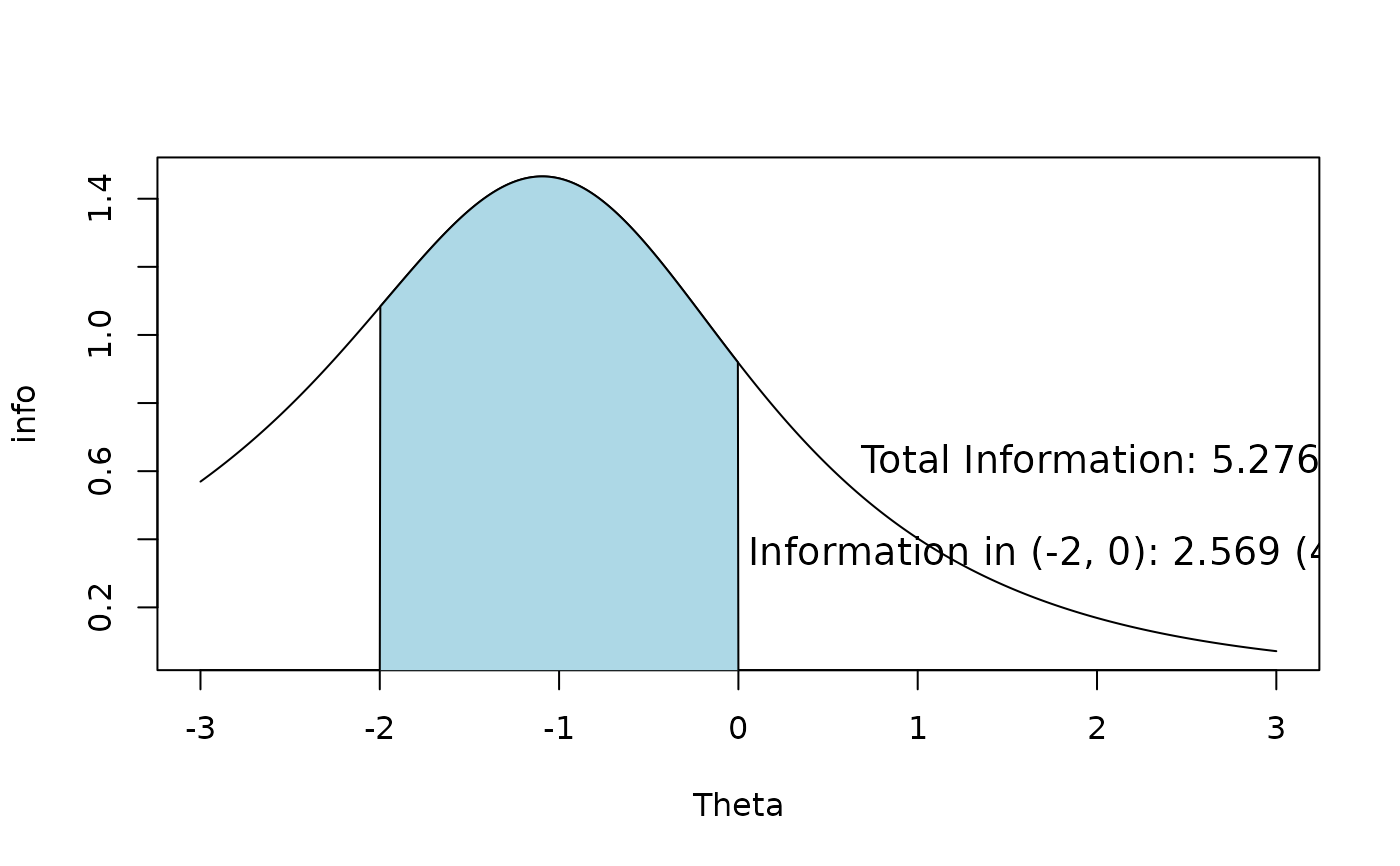
areainfo(mod, c(-2,0)) # all items (total test information)
#>  LowerBound UpperBound     Info TotalInfo Proportion nitems
#>          -2          0 2.568988  5.275594  0.4869571      5

# plot the area
area <- areainfo(mod, c(-2,0))
Theta <- matrix(seq(-3,3, length.out=1000))
info <- testinfo(mod, Theta)
plot(info ~ Theta, type = 'l')

pick <- Theta >= -2 & Theta <=0
polygon(c(-2, Theta[pick], 0), c(0, info[pick], 0), col='lightblue')
text(x = 2, y = 0.5, labels = paste("Total Information:", round(area$TotalInfo, 3),
           "\n\nInformation in (-2, 0):", round(area$Info, 3),
           paste("(", round(100 * area$Proportion, 2), "%)", sep = "")), cex = 1.2)


# }
# }