Computes item-fit statistics for a variety of unidimensional and multidimensional models.
Poorly fitting items should be inspected with the empirical plots/tables
for unidimensional models, otherwise itemGAM can be used to diagnose
where the functional form of the IRT model was misspecified, or models can be refit using
more flexible semi-parametric response models (e.g., itemtype = 'spline').
If the latent trait density was approximated (e.g., Davidian curves, Empirical histograms, etc)
then passing use_dentype_estimate = TRUE will use the internally saved quadrature and
density components (where applicable). Currently, only S-X2 statistic supported for
mixture IRT models. Finally, where applicable the root mean-square error of approximation (RMSEA)
is reported to help gauge the magnitude of item misfit.
Usage
itemfit(
  x,
  fit_stats = "S_X2",
  which.items = 1:extract.mirt(x, "nitems"),
  na.rm = FALSE,
  p.adjust = "none",
  group.bins = 10,
  group.size = NA,
  group.fun = mean,
  mincell = 1,
  mincell.X2 = 2,
  return.tables = FALSE,
  pv_draws = 30,
  boot = 1000,
  boot_dfapprox = 200,
  S_X2.plot = NULL,
  S_X2.plot_raw.score = TRUE,
  ETrange = c(-2, 2),
  ETpoints = 11,
  empirical.plot = NULL,
  empirical.CI = 0.95,
  empirical.poly.collapse = FALSE,
  method = "EAP",
  Theta = NULL,
  par.strip.text = list(cex = 0.7),
  par.settings = list(strip.background = list(col = "#9ECAE1"), strip.border = list(col =
    "black")),
  auto.key = list(space = "right", points = FALSE, lines = TRUE),
  ...
)
Arguments
- x
a computed model object of class
SingleGroupClass,MultipleGroupClass, orDiscreteClass- fit_stats
a character vector indicating which fit statistics should be computed. Supported inputs are:
'S_X2': Orlando and Thissen (2000, 2003) and Kang and Chen's (2007) signed chi-squared test (default)'Zh': Drasgow, Levine, & Williams (1985) Zh'X2': Bock's (1972) chi-squared method. The default inputs compute Yen's (1981) Q1 variant of the X2 statistic (i.e., uses a fixedgroup.bins = 10). However, Bock's group-size variable median-based method can be computed by passinggroup.fun = medianand modifying thegroup.sizeinput to the desired number of bins'G2': McKinley & Mills (1985) G2 statistic (similar method to Q1, but with the likelihood-ratio test).'PV_Q1': Chalmers and Ng's (2017) plausible-value variant of the Q1 statistic.'PV_Q1*': Chalmers and Ng's (2017) plausible-value variant of the Q1 statistic that uses parametric bootstrapping to obtain a suitable empirical distribution.'X2*': Stone's (2000) fit statistics that require parametric bootstrapping'X2*_df': Stone's (2000) fit statistics that require parametric bootstrapping to obtain scaled versions of the X2* and degrees of freedom'infit': Compute the infit and outfit statistics
Note that 'S_X2' and 'Zh' cannot be computed when there are missing response data (i.e., will require multiple-imputation/row-removal techniques).
- which.items
an integer vector indicating which items to test for fit. Default tests all possible items
- na.rm
logical; remove rows with any missing values? This is required for methods such as S-X2 because they require the "EAPsum" method from
fscores- p.adjust
method to use for adjusting all p-values for each respective item fit statistic (see
p.adjustfor available options). Default is'none'- group.bins
the number of bins to use for X2 and G2. For example, setting
group.bins = 10will will compute Yen's (1981) Q1 statistic when'X2'is requested- group.size
approximate size of each group to be used in calculating the \(\chi^2\) statistic. The default
NAdisables this command and instead uses thegroup.binsinput to try and construct equally sized bins- group.fun
function used when
'X2'or'G2'are computed. Determines the central tendency measure within each partitioned group. E.g., settinggroup.fun = medianwill obtain the median of each respective ability estimate in each subgroup (this is what was used by Bock, 1972)- mincell
the minimum expected cell size to be used in the S-X2 computations. Tables will be collapsed across items first if polytomous, and then across scores if necessary
- mincell.X2
the minimum expected cell size to be used in the X2 computations. Tables will be collapsed if polytomous, however if this condition can not be met then the group block will be omitted in the computations
- return.tables
logical; return tables when investigating
'X2','S_X2', and'X2*'?- pv_draws
number of plausible-value draws to obtain for PV_Q1 and PV_Q1*
- boot
number of parametric bootstrap samples to create for PV_Q1* and X2*
- boot_dfapprox
number of parametric bootstrap samples to create for the X2*_df statistic to approximate the scaling factor for X2* as well as the scaled degrees of freedom estimates
- S_X2.plot
argument input is the same as
empirical.plot, however the resulting image is constructed according to the S-X2 statistic's conditional sum-score information- S_X2.plot_raw.score
logical; use the raw-score information in the plot in stead of the latent trait scale score? Default is
FALSE- ETrange
range of integration nodes for Stone's X2* statistic
- ETpoints
number of integration nodes to use for Stone's X2* statistic
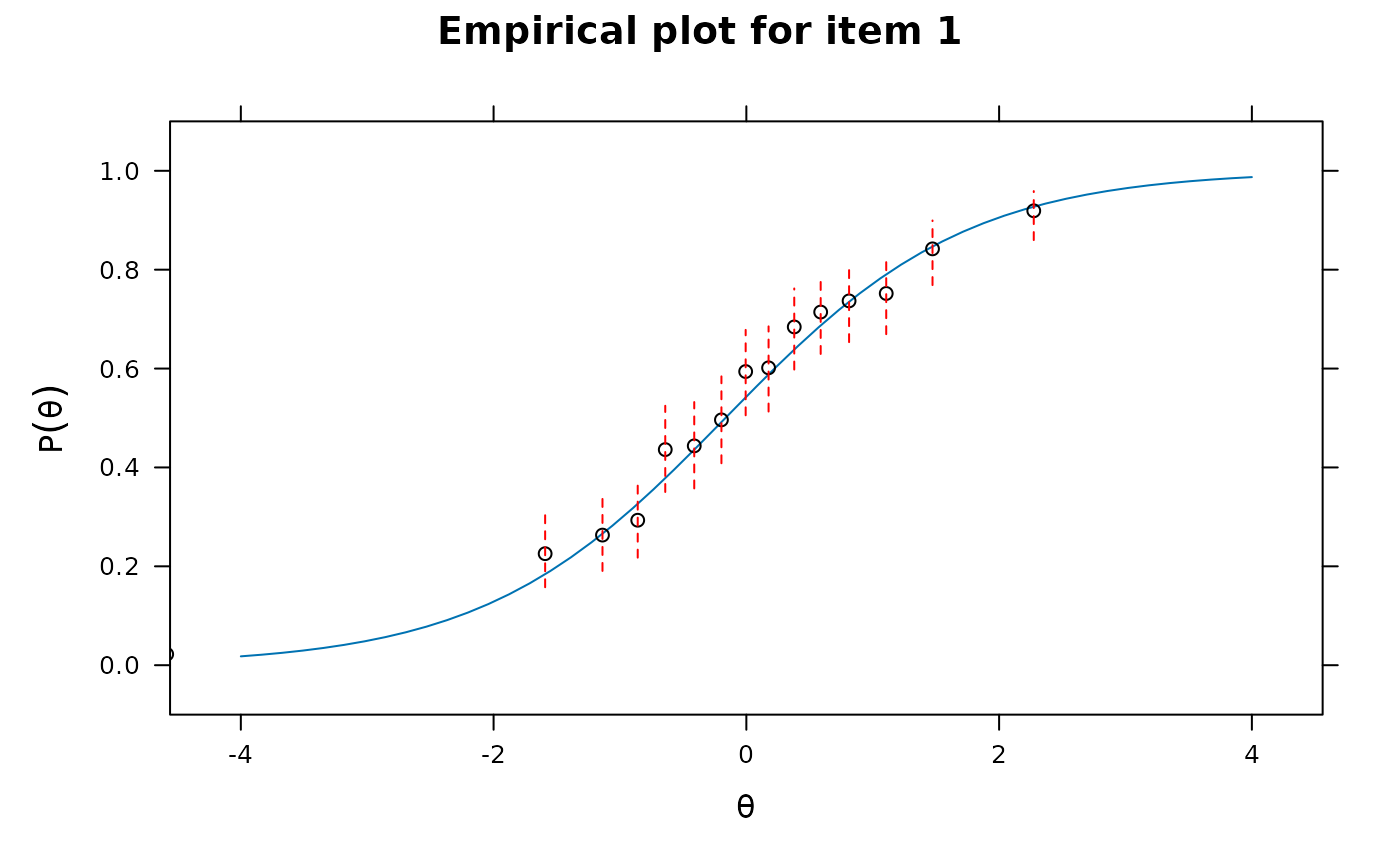
- empirical.plot
a single numeric value or character of the item name indicating which item to plot (via
itemplot) and overlay with the empirical \(\theta\) groupings (seeempirical.CI). Useful for plotting the expected bins based on the'X2'or'G2'method- empirical.CI
a numeric value indicating the width of the empirical confidence interval ranging between 0 and 1 (default of 0 plots not interval). For example, a 95 interval would be plotted when
empirical.CI = .95. Only applicable to dichotomous items- empirical.poly.collapse
logical; collapse polytomous item categories to for expected scoring functions for empirical plots? Default is
FALSE- method
type of factor score estimation method. See
fscoresfor more detail- Theta
a matrix of factor scores for each person used for statistics that require empirical estimates. If supplied, arguments typically passed to
fscores()will be ignored and these values will be used instead. Also required when estimating statistics with missing data via imputation- par.strip.text
plotting argument passed to
lattice- par.settings
plotting argument passed to
lattice- auto.key
plotting argument passed to
lattice- ...
References
Bock, R. D. (1972). Estimating item parameters and latent ability when responses are scored in two or more nominal categories. Psychometrika, 37, 29-51.
Chalmers, R., P. (2012). mirt: A Multidimensional Item Response Theory Package for the R Environment. Journal of Statistical Software, 48(6), 1-29. doi:10.18637/jss.v048.i06
Chalmers, R. P. & Ng, V. (2017). Plausible-Value Imputation Statistics for Detecting Item Misfit. Applied Psychological Measurement, 41, 372-387. doi:10.1177/0146621617692079
Drasgow, F., Levine, M. V., & Williams, E. A. (1985). Appropriateness measurement with polychotomous item response models and standardized indices. British Journal of Mathematical and Statistical Psychology, 38, 67-86.
Kang, T. & Chen, Troy, T. (2007). An investigation of the performance of the generalized S-X2 item-fit index for polytomous IRT models. ACT
McKinley, R., & Mills, C. (1985). A comparison of several goodness-of-fit statistics. Applied Psychological Measurement, 9, 49-57.
Orlando, M. & Thissen, D. (2000). Likelihood-based item fit indices for dichotomous item response theory models. Applied Psychological Measurement, 24, 50-64.
Reise, S. P. (1990). A comparison of item- and person-fit methods of assessing model-data fit in IRT. Applied Psychological Measurement, 14, 127-137.
Stone, C. A. (2000). Monte Carlo Based Null Distribution for an Alternative Goodness-of-Fit Test Statistics in IRT Models. Journal of Educational Measurement, 37, 58-75.
Wright B. D. & Masters, G. N. (1982). Rating scale analysis. MESA Press.
Yen, W. M. (1981). Using simulation results to choose a latent trait model. Applied Psychological Measurement, 5, 245-262.
Author
Phil Chalmers rphilip.chalmers@gmail.com
Examples
# \donttest{
P <- function(Theta){exp(Theta^2 * 1.2 - 1) / (1 + exp(Theta^2 * 1.2 - 1))}
#make some data
set.seed(1234)
a <- matrix(rlnorm(20, meanlog=0, sdlog = .1),ncol=1)
d <- matrix(rnorm(20),ncol=1)
Theta <- matrix(rnorm(2000))
items <- rep('2PL', 20)
ps <- P(Theta)
baditem <- numeric(2000)
for(i in 1:2000)
baditem[i] <- sample(c(0,1), 1, prob = c(1-ps[i], ps[i]))
data <- cbind(simdata(a,d, 2000, items, Theta=Theta), baditem=baditem)
x <- mirt(data, 1)
raschfit <- mirt(data, 1, itemtype='Rasch')
fit <- itemfit(x)
fit
#> item S_X2 df.S_X2 RMSEA.S_X2 p.S_X2
#> 1 Item_1 16.519 15 0.007 0.348
#> 2 Item_2 11.718 15 0.000 0.700
#> 3 Item_3 22.835 15 0.016 0.088
#> 4 Item_4 11.703 16 0.000 0.764
#> 5 Item_5 15.241 15 0.003 0.434
#> 6 Item_6 11.983 16 0.000 0.745
#> 7 Item_7 23.912 16 0.016 0.091
#> 8 Item_8 12.744 15 0.000 0.622
#> 9 Item_9 16.931 15 0.008 0.323
#> 10 Item_10 9.199 16 0.000 0.905
#> 11 Item_11 17.630 15 0.009 0.283
#> 12 Item_12 12.198 15 0.000 0.664
#> 13 Item_13 17.487 15 0.009 0.291
#> 14 Item_14 19.117 15 0.012 0.208
#> 15 Item_15 11.542 16 0.000 0.775
#> 16 Item_16 12.534 16 0.000 0.706
#> 17 Item_17 29.453 15 0.022 0.014
#> 18 Item_18 15.064 16 0.000 0.520
#> 19 Item_19 17.125 15 0.008 0.311
#> 20 Item_20 10.064 15 0.000 0.816
#> 21 baditem 233.224 18 0.077 0.000
# p-value adjustment
itemfit(x, p.adjust='fdr')
#> item S_X2 df.S_X2 RMSEA.S_X2 p.S_X2
#> 1 Item_1 16.519 15 0.007 0.732
#> 2 Item_2 11.718 15 0.000 0.856
#> 3 Item_3 22.835 15 0.016 0.480
#> 4 Item_4 11.703 16 0.000 0.856
#> 5 Item_5 15.241 15 0.003 0.829
#> 6 Item_6 11.983 16 0.000 0.856
#> 7 Item_7 23.912 16 0.016 0.480
#> 8 Item_8 12.744 15 0.000 0.856
#> 9 Item_9 16.931 15 0.008 0.732
#> 10 Item_10 9.199 16 0.000 0.905
#> 11 Item_11 17.630 15 0.009 0.732
#> 12 Item_12 12.198 15 0.000 0.856
#> 13 Item_13 17.487 15 0.009 0.732
#> 14 Item_14 19.117 15 0.012 0.732
#> 15 Item_15 11.542 16 0.000 0.856
#> 16 Item_16 12.534 16 0.000 0.856
#> 17 Item_17 29.453 15 0.022 0.148
#> 18 Item_18 15.064 16 0.000 0.856
#> 19 Item_19 17.125 15 0.008 0.732
#> 20 Item_20 10.064 15 0.000 0.856
#> 21 baditem 233.224 18 0.077 0.000
# two different fit stats (with/without p-value adjustment)
itemfit(x, c('S_X2' ,'X2'), p.adjust='fdr')
#> item X2 df.X2 RMSEA.X2 p.X2 S_X2 df.S_X2 RMSEA.S_X2 p.S_X2
#> 1 Item_1 30.842 8 0.038 0.000 16.519 15 0.007 0.732
#> 2 Item_2 27.970 8 0.035 0.001 11.718 15 0.000 0.856
#> 3 Item_3 43.995 8 0.047 0.000 22.835 15 0.016 0.480
#> 4 Item_4 33.272 8 0.040 0.000 11.703 16 0.000 0.856
#> 5 Item_5 29.469 8 0.037 0.001 15.241 15 0.003 0.829
#> 6 Item_6 21.325 8 0.029 0.007 11.983 16 0.000 0.856
#> 7 Item_7 23.127 8 0.031 0.004 23.912 16 0.016 0.480
#> 8 Item_8 25.332 8 0.033 0.002 12.744 15 0.000 0.856
#> 9 Item_9 33.778 8 0.040 0.000 16.931 15 0.008 0.732
#> 10 Item_10 22.972 8 0.031 0.004 9.199 16 0.000 0.905
#> 11 Item_11 27.300 8 0.035 0.001 17.630 15 0.009 0.732
#> 12 Item_12 23.256 8 0.031 0.004 12.198 15 0.000 0.856
#> 13 Item_13 31.523 8 0.038 0.000 17.487 15 0.009 0.732
#> 14 Item_14 27.924 8 0.035 0.001 19.117 15 0.012 0.732
#> 15 Item_15 18.462 8 0.026 0.020 11.542 16 0.000 0.856
#> 16 Item_16 25.057 8 0.033 0.002 12.534 16 0.000 0.856
#> 17 Item_17 14.828 8 0.021 0.063 29.453 15 0.022 0.148
#> 18 Item_18 17.676 8 0.025 0.025 15.064 16 0.000 0.856
#> 19 Item_19 32.585 8 0.039 0.000 17.125 15 0.008 0.732
#> 20 Item_20 37.207 8 0.043 0.000 10.064 15 0.000 0.856
#> 21 baditem 228.367 8 0.117 0.000 233.224 18 0.077 0.000
itemfit(x, c('S_X2' ,'X2'))
#> item X2 df.X2 RMSEA.X2 p.X2 S_X2 df.S_X2 RMSEA.S_X2 p.S_X2
#> 1 Item_1 30.842 8 0.038 0.000 16.519 15 0.007 0.348
#> 2 Item_2 27.970 8 0.035 0.000 11.718 15 0.000 0.700
#> 3 Item_3 43.995 8 0.047 0.000 22.835 15 0.016 0.088
#> 4 Item_4 33.272 8 0.040 0.000 11.703 16 0.000 0.764
#> 5 Item_5 29.469 8 0.037 0.000 15.241 15 0.003 0.434
#> 6 Item_6 21.325 8 0.029 0.006 11.983 16 0.000 0.745
#> 7 Item_7 23.127 8 0.031 0.003 23.912 16 0.016 0.091
#> 8 Item_8 25.332 8 0.033 0.001 12.744 15 0.000 0.622
#> 9 Item_9 33.778 8 0.040 0.000 16.931 15 0.008 0.323
#> 10 Item_10 22.972 8 0.031 0.003 9.199 16 0.000 0.905
#> 11 Item_11 27.300 8 0.035 0.001 17.630 15 0.009 0.283
#> 12 Item_12 23.256 8 0.031 0.003 12.198 15 0.000 0.664
#> 13 Item_13 31.523 8 0.038 0.000 17.487 15 0.009 0.291
#> 14 Item_14 27.924 8 0.035 0.000 19.117 15 0.012 0.208
#> 15 Item_15 18.462 8 0.026 0.018 11.542 16 0.000 0.775
#> 16 Item_16 25.057 8 0.033 0.002 12.534 16 0.000 0.706
#> 17 Item_17 14.828 8 0.021 0.063 29.453 15 0.022 0.014
#> 18 Item_18 17.676 8 0.025 0.024 15.064 16 0.000 0.520
#> 19 Item_19 32.585 8 0.039 0.000 17.125 15 0.008 0.311
#> 20 Item_20 37.207 8 0.043 0.000 10.064 15 0.000 0.816
#> 21 baditem 228.367 8 0.117 0.000 233.224 18 0.077 0.000
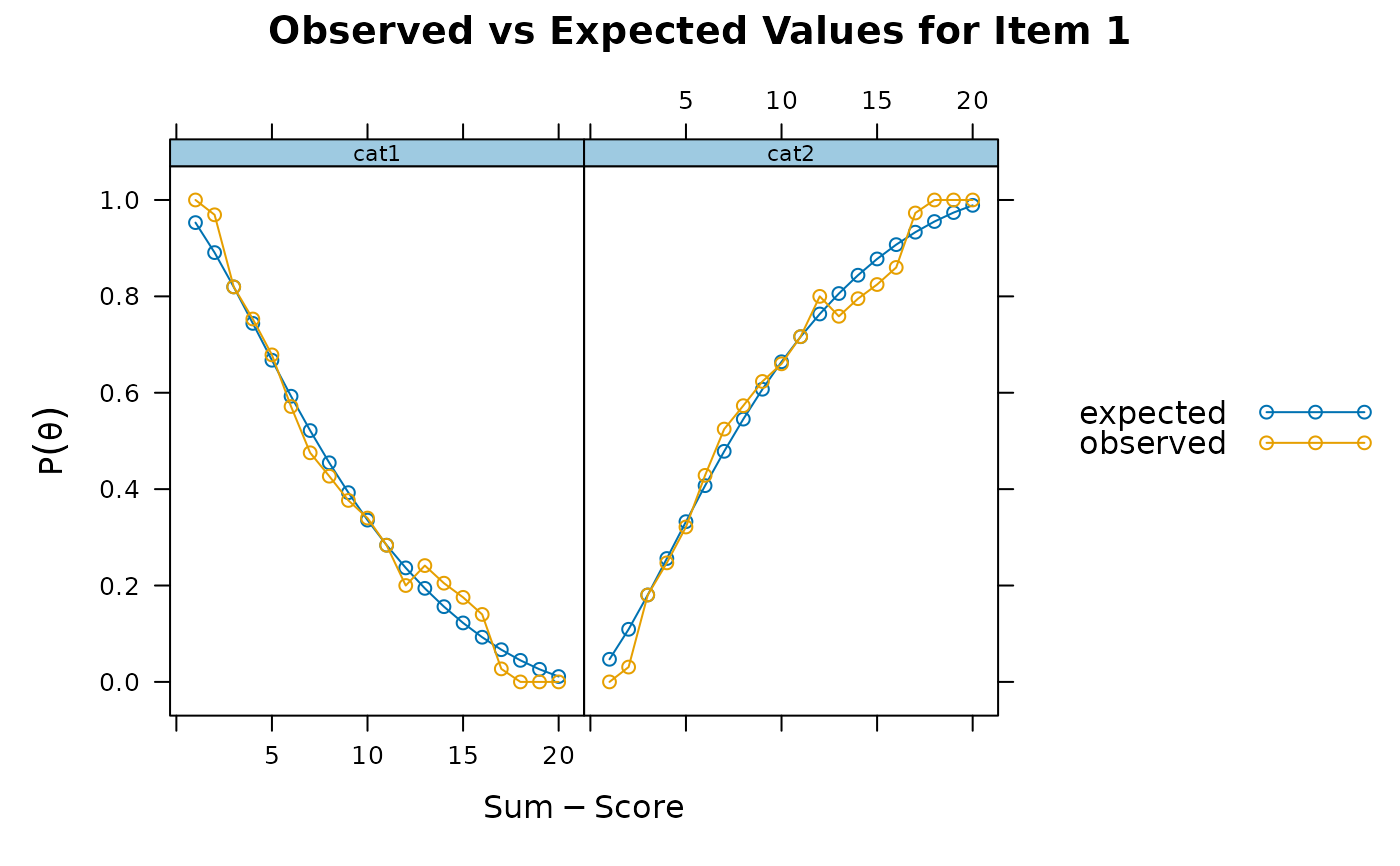
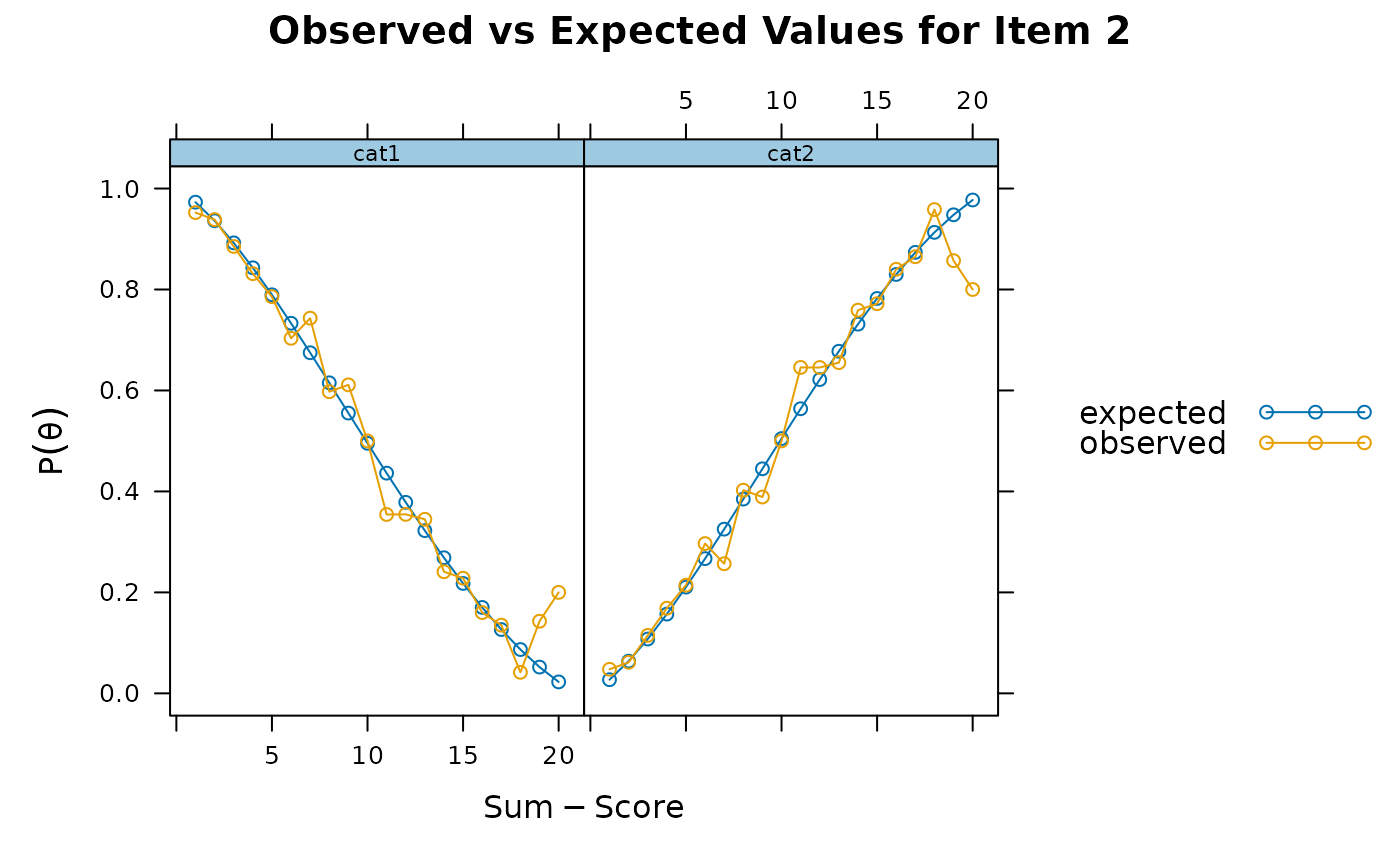
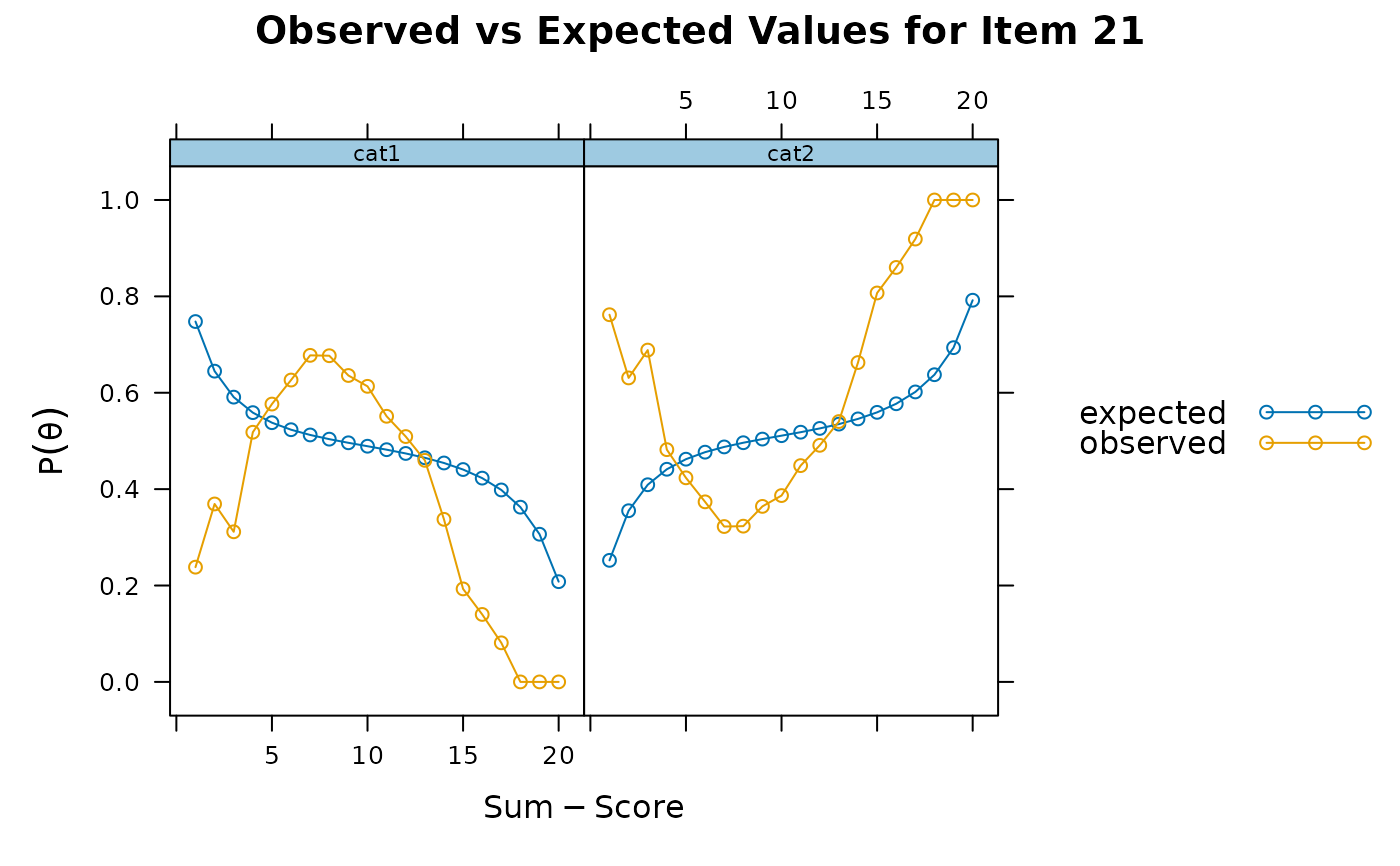
# Conditional sum-score plot from S-X2 information
itemfit(x, S_X2.plot = 1) # good fit
 itemfit(x, S_X2.plot = 2) # good fit
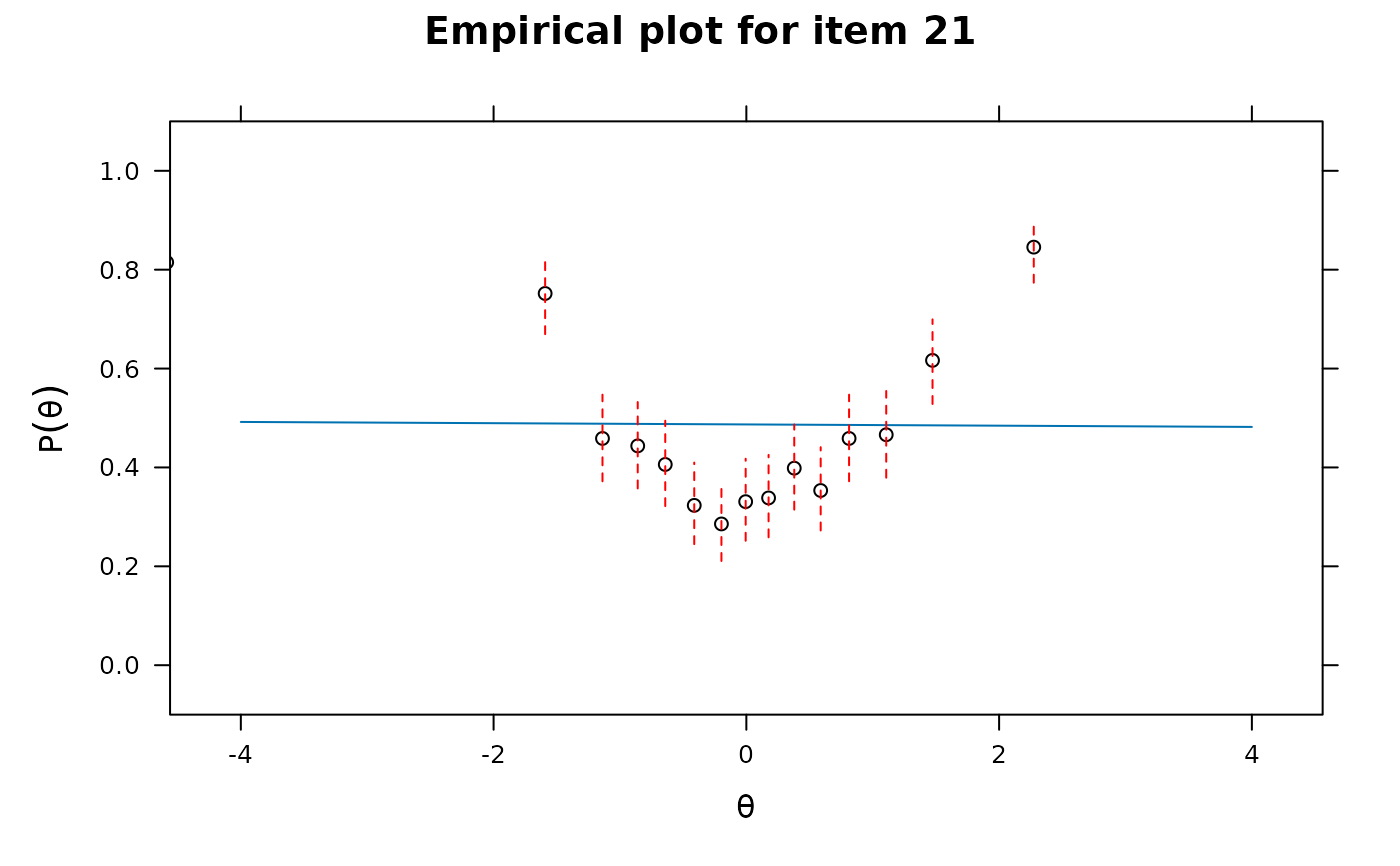
 itemfit(x, S_X2.plot = 21) # bad fit
 itemfit(x, 'X2') # just X2
#> item X2 df.X2 RMSEA.X2 p.X2
#> 1 Item_1 30.842 8 0.038 0.000
#> 2 Item_2 27.970 8 0.035 0.000
#> 3 Item_3 43.995 8 0.047 0.000
#> 4 Item_4 33.272 8 0.040 0.000
#> 5 Item_5 29.469 8 0.037 0.000
#> 6 Item_6 21.325 8 0.029 0.006
#> 7 Item_7 23.127 8 0.031 0.003
#> 8 Item_8 25.332 8 0.033 0.001
#> 9 Item_9 33.778 8 0.040 0.000
#> 10 Item_10 22.972 8 0.031 0.003
#> 11 Item_11 27.300 8 0.035 0.001
#> 12 Item_12 23.256 8 0.031 0.003
#> 13 Item_13 31.523 8 0.038 0.000
#> 14 Item_14 27.924 8 0.035 0.000
#> 15 Item_15 18.462 8 0.026 0.018
#> 16 Item_16 25.057 8 0.033 0.002
#> 17 Item_17 14.828 8 0.021 0.063
#> 18 Item_18 17.676 8 0.025 0.024
#> 19 Item_19 32.585 8 0.039 0.000
#> 20 Item_20 37.207 8 0.043 0.000
#> 21 baditem 228.367 8 0.117 0.000
itemfit(x, 'X2', method = 'ML') # X2 with maximum-likelihood estimates for traits
#> Warning: The following factor score estimates failed to converge successfully:
#> 311,315,352,518,677,748,909,927,1081,1243,1277,1305,1415,1480,1620,1893
#> item X2 df.X2 RMSEA.X2 p.X2
#> 1 Item_1 35.941 8 0.042 0.000
#> 2 Item_2 53.226 8 0.053 0.000
#> 3 Item_3 47.010 8 0.049 0.000
#> 4 Item_4 85.852 8 0.070 0.000
#> 5 Item_5 85.280 8 0.070 0.000
#> 6 Item_6 8.632 8 0.006 0.374
#> 7 Item_7 57.623 8 0.056 0.000
#> 8 Item_8 42.952 8 0.047 0.000
#> 9 Item_9 55.180 8 0.054 0.000
#> 10 Item_10 32.456 8 0.039 0.000
#> 11 Item_11 131.613 8 0.088 0.000
#> 12 Item_12 50.094 8 0.051 0.000
#> 13 Item_13 55.846 8 0.055 0.000
#> 14 Item_14 18.717 8 0.026 0.016
#> 15 Item_15 12.402 8 0.017 0.134
#> 16 Item_16 38.229 8 0.043 0.000
#> 17 Item_17 4.413 8 0.000 0.818
#> 18 Item_18 16.165 8 0.023 0.040
#> 19 Item_19 14.190 8 0.020 0.077
#> 20 Item_20 21.215 8 0.029 0.007
#> 21 baditem 227.191 8 0.117 0.000
itemfit(x, group.bins=15, empirical.plot = 1, method = 'ML') #empirical item plot with 15 points
#> Warning: The following factor score estimates failed to converge successfully:
#> 311,315,352,518,677,748,909,927,1081,1243,1277,1305,1415,1480,1620,1893
 itemfit(x, group.bins=15, empirical.plot = 21, method = 'ML')
#> Warning: The following factor score estimates failed to converge successfully:
#> 311,315,352,518,677,748,909,927,1081,1243,1277,1305,1415,1480,1620,1893
 # PV and X2* statistics (parametric bootstrap stats not run to save time)
itemfit(x, 'PV_Q1')
#> item PV_Q1 df.PV_Q1 RMSEA.PV_Q1 p.PV_Q1
#> 1 Item_1 8.984 8 0.008 0.344
#> 2 Item_2 9.441 8 0.009 0.306
#> 3 Item_3 7.162 8 0.000 0.519
#> 4 Item_4 8.463 8 0.005 0.390
#> 5 Item_5 8.755 8 0.007 0.363
#> 6 Item_6 9.411 8 0.009 0.309
#> 7 Item_7 8.678 8 0.007 0.370
#> 8 Item_8 8.269 8 0.004 0.408
#> 9 Item_9 9.005 8 0.008 0.342
#> 10 Item_10 6.873 8 0.000 0.550
#> 11 Item_11 9.871 8 0.011 0.274
#> 12 Item_12 9.214 8 0.009 0.325
#> 13 Item_13 8.889 8 0.007 0.352
#> 14 Item_14 9.088 8 0.008 0.335
#> 15 Item_15 8.583 8 0.006 0.379
#> 16 Item_16 8.848 8 0.007 0.355
#> 17 Item_17 8.408 8 0.005 0.395
#> 18 Item_18 8.000 8 0.000 0.433
#> 19 Item_19 8.742 8 0.007 0.365
#> 20 Item_20 7.823 8 0.000 0.451
#> 21 baditem 118.597 8 0.083 0.000
if(interactive()) mirtCluster() # improve speed of bootstrap samples by running in parallel
# itemfit(x, 'PV_Q1*')
# itemfit(x, 'X2*') # Stone's 1993 statistic
# itemfit(x, 'X2*_df') # Stone's 2000 scaled statistic with df estimate
# empirical tables for X2 statistic
tabs <- itemfit(x, 'X2', return.tables=TRUE, which.items = 1)
tabs
#> $`theta = -1.4531`
#> Observed Expected z.Residual
#> cat_0 183 158.63869 1.934176
#> cat_1 17 41.36131 -3.787943
#>
#> $`theta = -0.9416`
#> Observed Expected z.Residual
#> cat_0 149 138.43172 0.8982277
#> cat_1 51 61.56828 -1.3468702
#>
#> $`theta = -0.6475`
#> Observed Expected z.Residual
#> cat_0 132 124.64146 0.6591135
#> cat_1 68 75.35854 -0.8476670
#>
#> $`theta = -0.3921`
#> Observed Expected z.Residual
#> cat_0 112 111.77447 0.02133235
#> cat_1 88 88.22553 -0.02401114
#>
#> $`theta = -0.1393`
#> Observed Expected z.Residual
#> cat_0 88 98.63125 -1.070476
#> cat_1 112 101.36875 1.055923
#>
#> $`theta = 0.0936`
#> Observed Expected z.Residual
#> cat_0 86 86.5533 -0.05947283
#> cat_1 114 113.4467 0.05194748
#>
#> $`theta = 0.346`
#> Observed Expected z.Residual
#> cat_0 61 73.91477 -1.502177
#> cat_1 139 126.08523 1.150150
#>
#> $`theta = 0.6087`
#> Observed Expected z.Residual
#> cat_0 54 61.64828 -0.9740998
#> cat_1 146 138.35172 0.6502370
#>
#> $`theta = 0.9646`
#> Observed Expected z.Residual
#> cat_0 41 47.0127 -0.8769235
#> cat_1 159 152.9873 0.4861179
#>
#> $`theta = 1.5621`
#> Observed Expected z.Residual
#> cat_0 24 28.27768 -0.8044264
#> cat_1 176 171.72232 0.3264336
#>
#infit/outfit statistics. method='ML' agrees better with eRm package
itemfit(raschfit, 'infit', method = 'ML') #infit and outfit stats
#> item outfit z.outfit infit z.infit
#> 1 Item_1 0.919 -2.945 0.951 -2.699
#> 2 Item_2 0.962 -1.281 0.960 -2.010
#> 3 Item_3 0.876 -4.455 0.918 -4.332
#> 4 Item_4 0.998 -0.049 1.009 0.495
#> 5 Item_5 0.982 -0.523 0.974 -1.227
#> 6 Item_6 0.890 -2.233 0.950 -1.692
#> 7 Item_7 1.008 0.259 1.003 0.171
#> 8 Item_8 0.933 -1.743 0.961 -1.631
#> 9 Item_9 0.958 -1.519 0.964 -1.999
#> 10 Item_10 1.011 0.303 1.013 0.534
#> 11 Item_11 0.898 -2.300 0.939 -2.531
#> 12 Item_12 0.988 -0.383 1.012 0.607
#> 13 Item_13 0.991 -0.263 1.002 0.093
#> 14 Item_14 0.973 -0.841 0.974 -1.256
#> 15 Item_15 0.947 -0.943 0.993 -0.210
#> 16 Item_16 0.988 -0.271 0.985 -0.546
#> 17 Item_17 0.878 -1.532 0.960 -0.872
#> 18 Item_18 0.961 -0.759 0.978 -0.742
#> 19 Item_19 0.943 -2.060 0.974 -1.352
#> 20 Item_20 0.868 -4.736 0.911 -4.687
#> 21 baditem 1.513 16.123 1.338 16.509
#same as above, but inputting ML estimates instead (saves time for re-use)
Theta <- fscores(raschfit, method = 'ML')
itemfit(raschfit, 'infit', Theta=Theta)
#> item outfit z.outfit infit z.infit
#> 1 Item_1 0.919 -2.945 0.951 -2.699
#> 2 Item_2 0.962 -1.281 0.960 -2.010
#> 3 Item_3 0.876 -4.455 0.918 -4.332
#> 4 Item_4 0.998 -0.049 1.009 0.495
#> 5 Item_5 0.982 -0.523 0.974 -1.227
#> 6 Item_6 0.890 -2.233 0.950 -1.692
#> 7 Item_7 1.008 0.259 1.003 0.171
#> 8 Item_8 0.933 -1.743 0.961 -1.631
#> 9 Item_9 0.958 -1.519 0.964 -1.999
#> 10 Item_10 1.011 0.303 1.013 0.534
#> 11 Item_11 0.898 -2.300 0.939 -2.531
#> 12 Item_12 0.988 -0.383 1.012 0.607
#> 13 Item_13 0.991 -0.263 1.002 0.093
#> 14 Item_14 0.973 -0.841 0.974 -1.256
#> 15 Item_15 0.947 -0.943 0.993 -0.210
#> 16 Item_16 0.988 -0.271 0.985 -0.546
#> 17 Item_17 0.878 -1.532 0.960 -0.872
#> 18 Item_18 0.961 -0.759 0.978 -0.742
#> 19 Item_19 0.943 -2.060 0.974 -1.352
#> 20 Item_20 0.868 -4.736 0.911 -4.687
#> 21 baditem 1.513 16.123 1.338 16.509
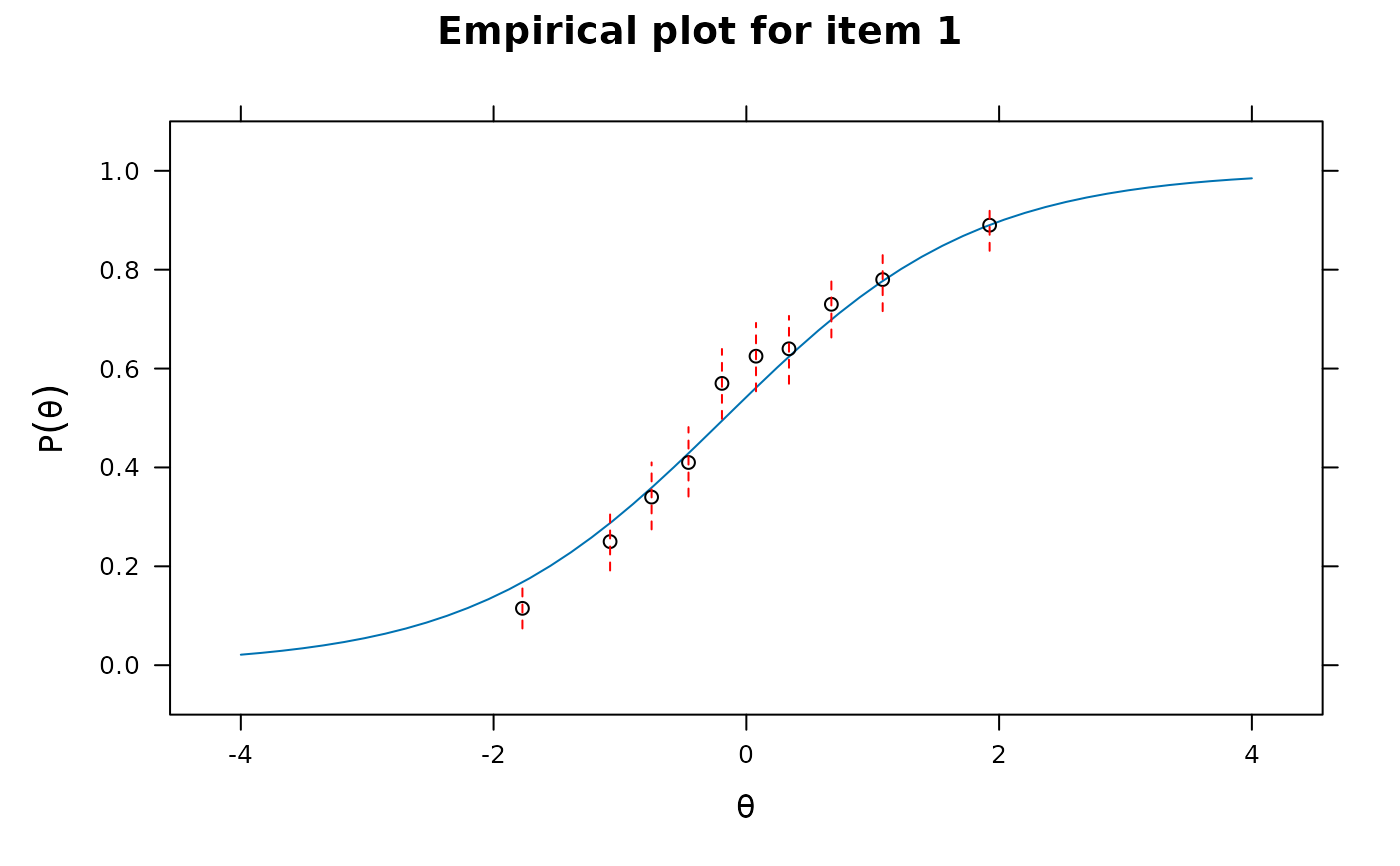
itemfit(raschfit, empirical.plot=1, Theta=Theta)
 itemfit(raschfit, 'X2', return.tables=TRUE, Theta=Theta, which.items=1)
#> $`theta = -1.7718`
#> Observed Expected z.Residual
#> cat_0 176 166.44926 0.7402803
#> cat_1 24 33.55074 -1.6488687
#>
#> $`theta = -1.0782`
#> Observed Expected z.Residual
#> cat_0 153 142.51602 0.8782018
#> cat_1 47 57.48398 -1.3827790
#>
#> $`theta = -0.7497`
#> Observed Expected z.Residual
#> cat_0 132 128.19072 0.3364454
#> cat_1 68 71.80928 -0.4495237
#>
#> $`theta = -0.4577`
#> Observed Expected z.Residual
#> cat_0 113 114.2782 -0.1195689
#> cat_1 87 85.7218 0.1380557
#>
#> $`theta = -0.193`
#> Observed Expected z.Residual
#> cat_0 84 101.13957 -1.704274
#> cat_1 116 98.86043 1.723807
#>
#> $`theta = 0.0765`
#> Observed Expected z.Residual
#> cat_0 78 87.7275 -1.0385643
#> cat_1 122 112.2725 0.9180463
#>
#> $`theta = 0.3374`
#> Observed Expected z.Residual
#> cat_0 76 75.15333 0.09766532
#> cat_1 124 124.84667 -0.07577501
#>
#> $`theta = 0.6728`
#> Observed Expected z.Residual
#> cat_0 50 60.18187 -1.3124859
#> cat_1 150 139.81813 0.8610844
#>
#> $`theta = 1.0787`
#> Observed Expected z.Residual
#> cat_0 47 44.57924 0.3625654
#> cat_1 153 155.42076 -0.1941771
#>
#> $`theta = 1.9249`
#> Observed Expected z.Residual
#> cat_0 21 21.91506 -0.19546933
#> cat_1 179 178.08494 0.06857035
#>
# fit a new more flexible model for the mis-fitting item
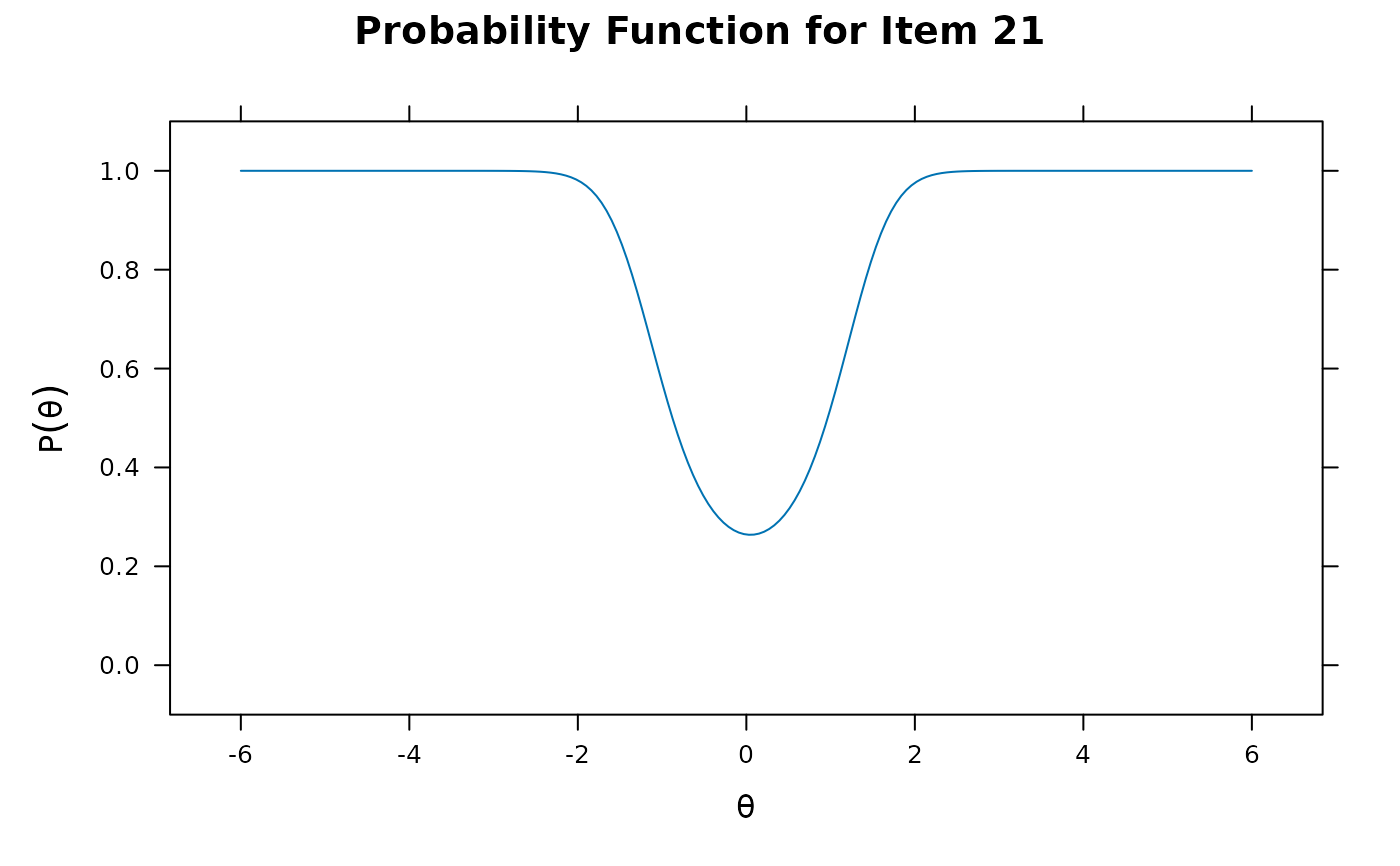
itemtype <- c(rep('2PL', 20), 'spline')
x2 <- mirt(data, 1, itemtype=itemtype)
#> Warning: EM cycles terminated after 500 iterations.
itemfit(x2)
#> item S_X2 df.S_X2 RMSEA.S_X2 p.S_X2
#> 1 Item_1 13.109 15 0.000 0.594
#> 2 Item_2 13.513 15 0.000 0.563
#> 3 Item_3 21.887 15 0.015 0.111
#> 4 Item_4 9.894 15 0.000 0.826
#> 5 Item_5 16.248 15 0.006 0.366
#> 6 Item_6 10.218 16 0.000 0.855
#> 7 Item_7 18.279 15 0.010 0.248
#> 8 Item_8 13.587 16 0.000 0.629
#> 9 Item_9 13.485 15 0.000 0.565
#> 10 Item_10 10.569 16 0.000 0.835
#> 11 Item_11 16.325 15 0.007 0.361
#> 12 Item_12 9.663 15 0.000 0.840
#> 13 Item_13 19.394 16 0.010 0.249
#> 14 Item_14 16.357 15 0.007 0.359
#> 15 Item_15 9.410 16 0.000 0.896
#> 16 Item_16 13.578 16 0.000 0.630
#> 17 Item_17 29.945 16 0.021 0.018
#> 18 Item_18 15.058 16 0.000 0.520
#> 19 Item_19 15.663 15 0.005 0.405
#> 20 Item_20 9.333 15 0.000 0.859
#> 21 baditem 11.473 13 0.000 0.571
itemplot(x2, 21)
 anova(x, x2)
#> AIC SABIC HQ BIC logLik X2 df p
#> x 49477.85 49579.65 49564.23 49713.09 -24696.93
#> x2 49214.97 49321.62 49305.46 49461.41 -24563.49 266.88 2 0
#------------------------------------------------------------
#similar example to Kang and Chen 2007
a <- matrix(c(.8,.4,.7, .8, .4, .7, 1, 1, 1, 1))
d <- matrix(rep(c(2.0,0.0,-1,-1.5),10), ncol=4, byrow=TRUE)
dat <- simdata(a,d,2000, itemtype = rep('graded', 10))
head(dat)
#> Item_1 Item_2 Item_3 Item_4 Item_5 Item_6 Item_7 Item_8 Item_9 Item_10
#> [1,] 4 0 1 4 1 4 3 2 1 4
#> [2,] 2 1 1 3 2 4 2 1 4 2
#> [3,] 2 2 3 0 0 0 4 4 4 4
#> [4,] 1 2 4 1 2 2 2 2 0 4
#> [5,] 1 3 0 2 1 4 4 4 3 1
#> [6,] 1 3 3 2 3 1 1 2 0 1
mod <- mirt(dat, 1)
itemfit(mod)
#> item S_X2 df.S_X2 RMSEA.S_X2 p.S_X2
#> 1 Item_1 143.021 103 0.014 0.006
#> 2 Item_2 85.589 109 0.000 0.953
#> 3 Item_3 110.835 105 0.005 0.330
#> 4 Item_4 121.145 103 0.009 0.107
#> 5 Item_5 107.875 111 0.000 0.566
#> 6 Item_6 93.905 102 0.000 0.704
#> 7 Item_7 113.544 99 0.009 0.151
#> 8 Item_8 100.858 99 0.003 0.429
#> 9 Item_9 83.214 98 0.000 0.857
#> 10 Item_10 104.402 99 0.005 0.336
itemfit(mod, 'X2') # less useful given inflated Type I error rates
#> item X2 df.X2 RMSEA.X2 p.X2
#> 1 Item_1 93.925 35 0.029 0.000
#> 2 Item_2 43.667 35 0.011 0.149
#> 3 Item_3 81.354 35 0.026 0.000
#> 4 Item_4 90.490 35 0.028 0.000
#> 5 Item_5 36.169 35 0.004 0.414
#> 6 Item_6 97.559 35 0.030 0.000
#> 7 Item_7 129.917 35 0.037 0.000
#> 8 Item_8 130.263 35 0.037 0.000
#> 9 Item_9 141.266 35 0.039 0.000
#> 10 Item_10 117.650 35 0.034 0.000
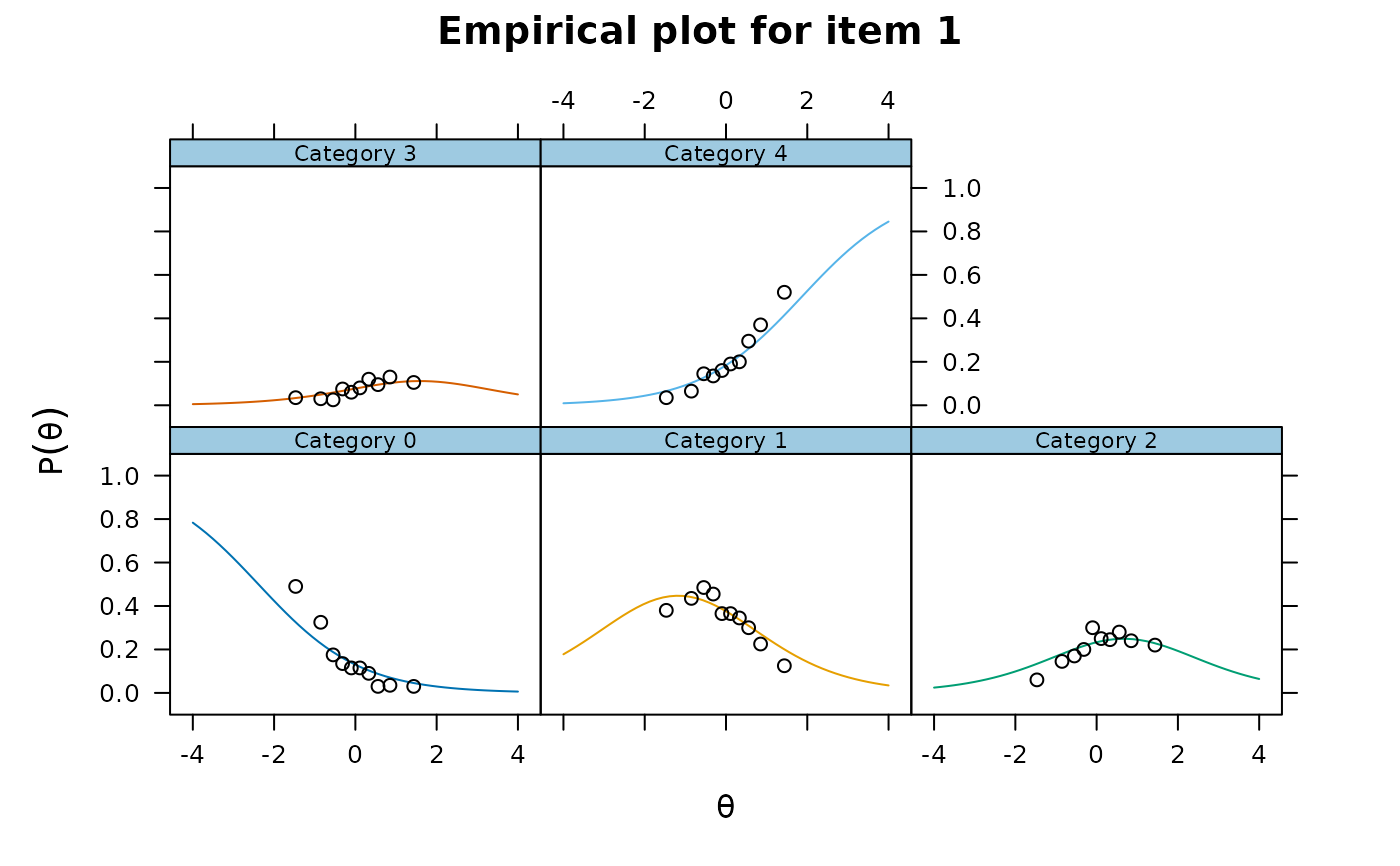
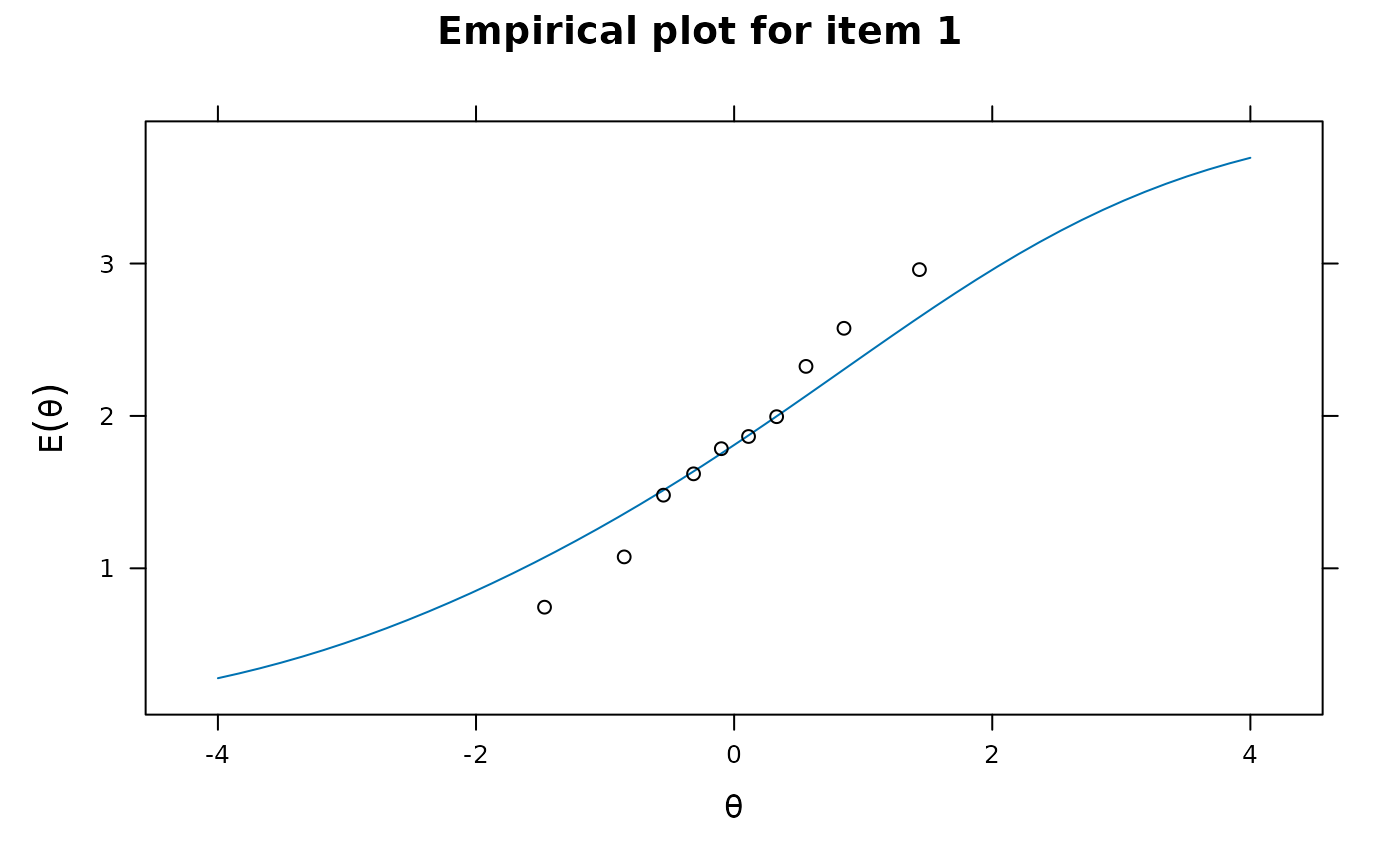
itemfit(mod, empirical.plot = 1)
 itemfit(mod, empirical.plot = 1, empirical.poly.collapse=TRUE)
 # collapsed tables (see mincell.X2) for X2 and G2
itemfit(mod, 'X2', return.tables = TRUE, which.items = 1)
#> $`theta = -1.4692`
#> Observed Expected z.Residual
#> cat_0 98 65.020718 4.0899247
#> cat_1 76 88.468143 -1.3255872
#> cat_2 12 26.774054 -2.8552400
#> cat_3 7 6.656543 0.1331215
#> cat_4 7 13.080542 -1.6812388
#>
#> $`theta = -0.8519`
#> Observed Expected z.Residual
#> cat_0 65 45.508938 2.8892636
#> cat_1 87 88.222767 -0.1301827
#> cat_2 29 35.896766 -1.1511126
#> cat_3 6 9.834511 -1.2227385
#> cat_4 13 20.537019 -1.6631481
#>
#> $`theta = -0.5476`
#> Observed Expected z.Residual
#> cat_0 35 37.54994 -0.4161270
#> cat_1 97 85.03642 1.2973549
#> cat_2 34 40.25662 -0.9861003
#> cat_3 5 11.70198 -1.9591763
#> cat_4 29 25.45504 0.7026267
#>
#> $`theta = -0.3145`
#> Observed Expected z.Residual
#> cat_0 27 32.21053 -0.9180857
#> cat_1 91 81.40120 1.0639013
#> cat_2 40 43.28252 -0.4989437
#> cat_3 15 13.23174 0.4861130
#> cat_4 27 29.87400 -0.5258232
#>
#> $`theta = -0.0993`
#> Observed Expected z.Residual
#> cat_0 23 27.84181 -0.9176111
#> cat_1 73 77.27754 -0.4865943
#> cat_2 60 45.69537 2.1161218
#> cat_3 12 14.68759 -0.7012737
#> cat_4 32 34.49770 -0.4252515
#>
#> $`theta = 0.1116`
#> Observed Expected z.Residual
#> cat_0 23 24.05321 -0.21474860
#> cat_1 73 72.66989 0.03872444
#> cat_2 50 47.59720 0.34827910
#> cat_3 16 16.11821 -0.02944308
#> cat_4 38 39.56149 -0.24825845
#>
#> $`theta = 0.3293`
#> Observed Expected z.Residual
#> cat_0 18 20.61824 -0.576612407
#> cat_1 69 67.48888 0.183942450
#> cat_2 49 48.98546 0.002077898
#> cat_3 24 17.55297 1.538809131
#> cat_4 40 45.35445 -0.795069543
#>
#> $`theta = 0.5568`
#> Observed Expected z.Residual
#> cat_0 6 17.49926 -2.74890777
#> cat_1 60 61.79242 -0.22801909
#> cat_2 56 49.73600 0.88821096
#> cat_3 19 18.94936 0.01163316
#> cat_4 59 52.02296 0.96732827
#>
#> $`theta = 0.8512`
#> Observed Expected z.Residual
#> cat_0 7 14.09896 -1.8906068
#> cat_1 45 54.28449 -1.2601441
#> cat_2 48 49.58044 -0.2244513
#> cat_3 26 20.49440 1.2161493
#> cat_4 74 61.54171 1.5880848
#>
#> $`theta = 1.4358`
#> Observed Expected z.Residual
#> cat_0 6 9.087564 -1.0242177
#> cat_1 25 40.094053 -2.3837784
#> cat_2 44 45.694100 -0.2506161
#> cat_3 21 22.208083 -0.2563547
#> cat_4 104 82.916200 2.3154169
#>
mod2 <- mirt(dat, 1, 'Rasch')
itemfit(mod2, 'infit', method = 'ML')
#> item outfit z.outfit infit z.infit
#> 1 Item_1 0.959 -1.405 0.946 -2.138
#> 2 Item_2 1.098 3.228 1.074 2.794
#> 3 Item_3 0.962 -1.324 0.961 -1.572
#> 4 Item_4 0.946 -1.865 0.932 -2.702
#> 5 Item_5 1.121 3.945 1.094 3.498
#> 6 Item_6 0.917 -2.900 0.917 -3.294
#> 7 Item_7 0.864 -4.827 0.881 -4.897
#> 8 Item_8 0.873 -4.654 0.880 -5.023
#> 9 Item_9 0.876 -4.465 0.887 -4.694
#> 10 Item_10 0.883 -4.253 0.892 -4.517
# massive list of tables for S-X2
tables <- itemfit(mod, return.tables = TRUE)
#observed and expected total score patterns for item 1 (post collapsing)
tables$O[[1]]
#> 0 1 2 3 4
#> 4 12 3 0 0 0
#> 5 6 1 0 0 0
#> 6 8 17 1 0 0
#> 7 12 16 5 0 0
#> 8 22 8 0 0 0
#> 9 30 20 3 3 1
#> 10 19 27 9 1 7
#> 11 16 32 9 4 0
#> 12 17 40 17 1 5
#> 13 25 51 15 4 8
#> 14 22 44 14 3 8
#> 15 22 46 22 5 14
#> 16 14 41 32 8 24
#> 17 11 42 31 8 10
#> 18 11 57 25 7 25
#> 19 17 41 37 11 15
#> 20 11 35 28 12 26
#> 21 10 32 32 8 22
#> 22 5 32 18 15 29
#> 23 2 23 17 7 33
#> 24 2 30 22 9 23
#> 25 3 15 19 7 28
#> 26 3 12 16 11 23
#> 27 4 13 12 4 19
#> 28 3 6 9 5 18
#> 29 3 6 2 17 0
#> 30 3 10 2 21 0
#> 31 1 2 1 13 0
#> 32 1 4 5 6 0
#> 33 3 4 4 5 0
#> 34 1 3 1 11 0
#> 35 2 6 0 0 0
#> 36 2 6 0 0 0
tables$E[[1]]
#> [,1] [,2] [,3] [,4] [,5]
#> [1,] 11.023325 3.976675 NA NA NA
#> [2,] 4.102366 2.897634 NA NA NA
#> [3,] 13.498246 10.610902 1.890852 NA NA
#> [4,] 15.184304 14.492730 3.322965 NA NA
#> [5,] 12.249443 13.799872 3.950685 NA NA
#> [6,] 20.682046 26.920288 6.923239 1.157706 1.316720
#> [7,] 20.332439 30.097150 8.830861 1.641385 2.098165
#> [8,] 17.517441 29.135716 9.625822 1.958940 2.762080
#> [9,] 20.446921 37.829468 13.940499 3.072836 4.710276
#> [10,] 23.437800 47.811327 19.504466 4.622495 7.623912
#> [11,] 18.436615 41.167389 18.467918 4.679944 8.248134
#> [12,] 19.651227 47.756678 23.431406 6.318731 11.841957
#> [13,] 19.076413 50.199010 26.830125 7.670547 15.223905
#> [14,] 14.528071 41.195659 23.904020 7.227464 15.144786
#> [15,] 15.799085 48.086720 30.192468 9.636968 21.284760
#> [16,] 13.544069 44.116503 29.895563 10.055666 23.388198
#> [17,] 11.078348 38.500292 28.110440 9.952500 24.358420
#> [18,] 9.068050 33.529616 26.330542 9.809752 25.262041
#> [19,] 7.581094 29.780090 25.109651 9.840833 26.688332
#> [20,] 5.489874 22.880802 20.702905 8.532437 24.393982
#> [21,] 5.010515 22.116677 21.467501 9.311108 28.094199
#> [22,] 3.626463 16.954931 17.637672 8.059013 25.721921
#> [23,] 2.805419 13.907880 15.517623 7.472196 25.296882
#> [24,] 1.907017 10.013898 12.004816 6.104317 21.969952
#> [25,] 1.261885 7.039995 9.063539 4.881523 18.753058
#> [26,] 4.944641 5.875443 3.354204 13.825711 NA
#> [27,] 5.454637 7.095249 4.313860 19.136254 NA
#> [28,] 2.176787 3.093386 2.019117 9.710709 NA
#> [29,] 1.685470 2.659415 1.858932 9.796184 NA
#> [30,] 1.334541 2.384692 1.813140 10.467628 NA
#> [31,] 1.040082 2.042086 1.733955 11.183876 NA
#> [32,] 2.050562 5.949438 NA NA NA
#> [33,] 1.369048 6.630952 NA NA NA
# can also select specific items
# itemfit(mod, return.tables = TRUE, which.items=1)
# fit stats with missing data (run in parallel using all cores)
dat[sample(1:prod(dim(dat)), 100)] <- NA
raschfit <- mirt(dat, 1, itemtype='Rasch')
# use only valid data by removing rows with missing terms
itemfit(raschfit, c('S_X2', 'infit'), na.rm = TRUE)
#> Sample size after row-wise response data removal: 1901
#> item outfit z.outfit infit z.infit S_X2 df.S_X2 RMSEA.S_X2 p.S_X2
#> 1 Item_1 0.906 -3.625 0.911 -3.659 155.056 102 0.017 0.001
#> 2 Item_2 0.997 -0.106 1.004 0.147 146.669 103 0.015 0.003
#> 3 Item_3 0.917 -3.281 0.919 -3.384 114.785 103 0.008 0.201
#> 4 Item_4 0.884 -4.447 0.896 -4.290 121.469 102 0.010 0.092
#> 5 Item_5 1.006 0.236 1.009 0.350 204.462 103 0.023 0.000
#> 6 Item_6 0.880 -4.514 0.895 -4.215 93.809 103 0.000 0.730
#> 7 Item_7 0.852 -5.851 0.866 -5.666 129.874 102 0.012 0.033
#> 8 Item_8 0.862 -5.635 0.870 -5.607 120.877 102 0.010 0.098
#> 9 Item_9 0.855 -5.840 0.867 -5.721 96.809 102 0.000 0.627
#> 10 Item_10 0.852 -6.126 0.863 -6.018 111.850 101 0.008 0.216
# note that X2, G2, PV-Q1, and X2* do not require complete datasets
thetas <- fscores(raschfit, method = 'ML') # save for faster computations
itemfit(raschfit, c('X2', 'G2'), Theta=thetas)
#> item X2 df.X2 RMSEA.X2 p.X2 G2 df.G2 RMSEA.G2 p.G2
#> 1 Item_1 51.259 36 0.015 0.048 54.104 36 0.016 0.027
#> 2 Item_2 76.301 36 0.024 0.000 70.608 36 0.022 0.000
#> 3 Item_3 48.645 36 0.013 0.078 48.882 36 0.013 0.074
#> 4 Item_4 38.461 36 0.006 0.359 36.226 36 0.002 0.458
#> 5 Item_5 99.608 36 0.030 0.000 88.020 36 0.027 0.000
#> 6 Item_6 29.445 36 0.000 0.772 30.348 36 0.000 0.734
#> 7 Item_7 70.090 36 0.022 0.001 76.080 35 0.024 0.000
#> 8 Item_8 53.968 36 0.016 0.028 57.460 36 0.017 0.013
#> 9 Item_9 61.871 36 0.019 0.005 64.083 36 0.020 0.003
#> 10 Item_10 51.293 36 0.015 0.047 55.783 36 0.017 0.019
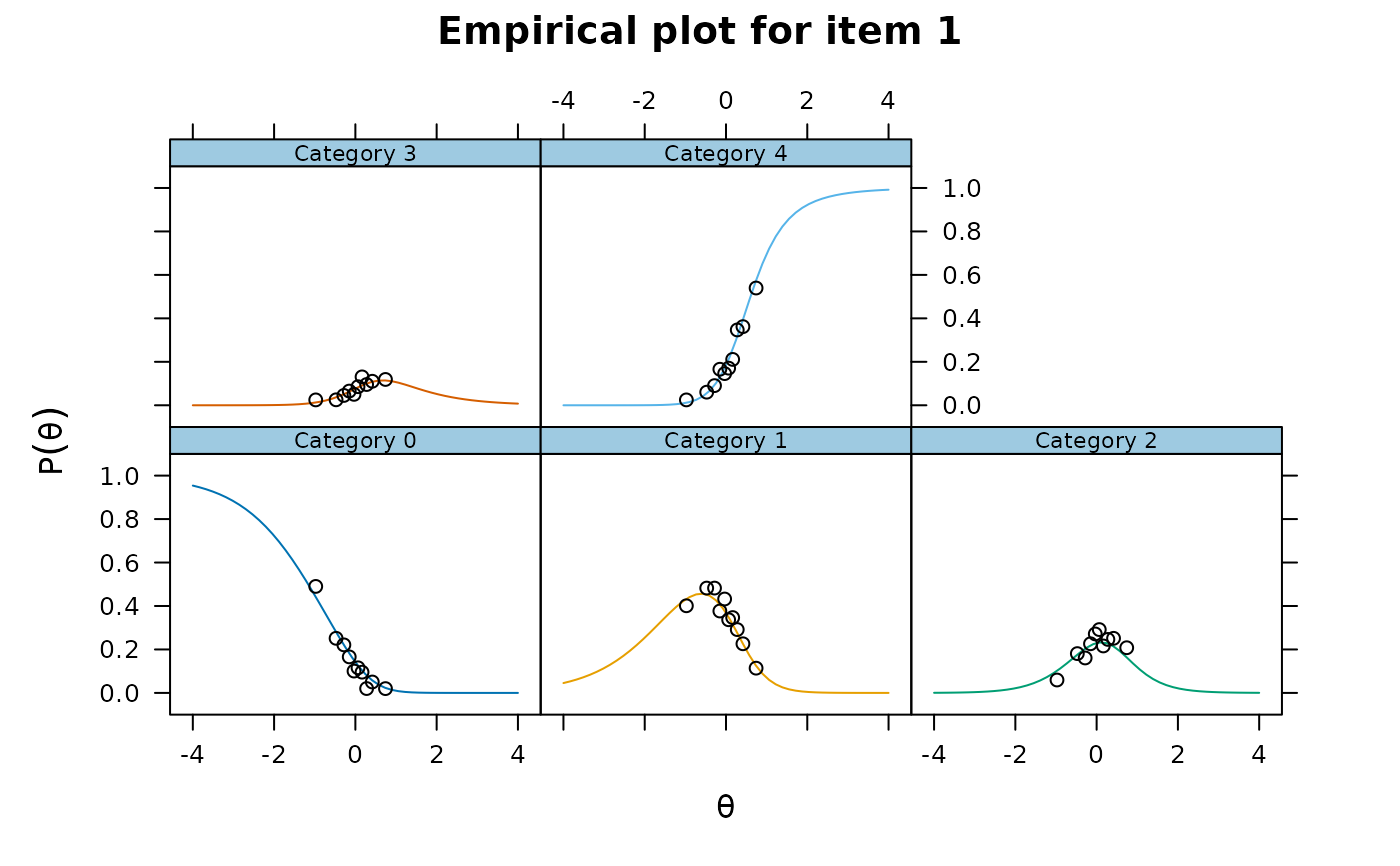
itemfit(raschfit, empirical.plot=1, Theta=thetas)
 itemfit(raschfit, 'X2', return.tables=TRUE, which.items=1, Theta=thetas)
#> $`theta = -0.9751`
#> Observed Expected z.Residual
#> cat_0 99 89.20262 1.0373403
#> cat_1 81 87.31985 -0.6763169
#> cat_2 15 20.55256 -1.2247865
#> cat_3 5 2.58492 1.5021312
#> cat_4 2 2.34005 -0.2222955
#>
#> $`theta = -0.4747`
#> Observed Expected z.Residual
#> cat_0 50 55.809618 -0.7776658
#> cat_1 97 90.111768 0.7256330
#> cat_2 34 34.984170 -0.1663927
#> cat_3 5 7.257547 -0.8379959
#> cat_4 13 10.836898 0.6570896
#>
#> $`theta = -0.2825`
#> Observed Expected z.Residual
#> cat_0 47 43.95300 0.45959793
#> cat_1 94 86.00337 0.86228151
#> cat_2 31 40.46318 -1.48767205
#> cat_3 9 10.17262 -0.36765541
#> cat_4 18 18.40782 -0.09505398
#>
#> $`theta = -0.151`
#> Observed Expected z.Residual
#> cat_0 31 36.30294 -0.8801282
#> cat_1 76 81.02067 -0.5577815
#> cat_2 45 43.47779 0.2308554
#> cat_3 13 12.46715 0.1509097
#> cat_4 34 25.73144 1.6300392
#>
#> $`theta = -0.0334`
#> Observed Expected z.Residual
#> cat_0 18 29.93123 -2.1808355
#> cat_1 85 75.13552 1.1380247
#> cat_2 55 45.35066 1.4328669
#> cat_3 10 14.62683 -1.2097853
#> cat_4 31 33.95577 -0.5072398
#>
#> $`theta = 0.0651`
#> Observed Expected z.Residual
#> cat_0 25 25.01915 -0.003828458
#> cat_1 67 69.30483 -0.276857520
#> cat_2 56 46.16066 1.448204831
#> cat_3 18 16.42891 0.387611329
#> cat_4 33 42.08645 -1.400629571
#>
#> $`theta = 0.1642`
#> Observed Expected z.Residual
#> cat_0 18 20.52849 -0.5580631
#> cat_1 64 62.79335 0.1522733
#> cat_2 47 46.18361 0.1201310
#> cat_3 23 18.15057 1.1382706
#> cat_4 47 51.34398 -0.6062375
#>
#> $`theta = 0.2767`
#> Observed Expected z.Residual
#> cat_0 5 16.04476 -2.7573357
#> cat_1 68 54.92361 1.7644462
#> cat_2 42 45.20667 -0.4769282
#> cat_3 22 19.88265 0.4748496
#> cat_4 62 62.94232 -0.1187750
#>
#> $`theta = 0.4165`
#> Observed Expected z.Residual
#> cat_0 7 11.43239 -1.3109001
#> cat_1 42 45.00297 -0.4476416
#> cat_2 56 42.59542 2.0538652
#> cat_3 21 21.54333 -0.1170590
#> cat_4 73 78.42590 -0.6126913
#>
#> $`theta = 0.7405`
#> Observed Expected z.Residual
#> cat_0 6 4.630988 0.6361658
#> cat_1 22 25.205518 -0.6384846
#> cat_2 40 32.986419 1.2211590
#> cat_3 24 23.067629 0.1941276
#> cat_4 110 116.109445 -0.5669803
#>
# }